111.1% on the Invoice, 3.2% More Pieces: Who Gets Paid While China's Chip Count Stays Slow
Sellers of chips that already cleared Chinese customs were paid on the invoice. The piece count is still the stuck step.

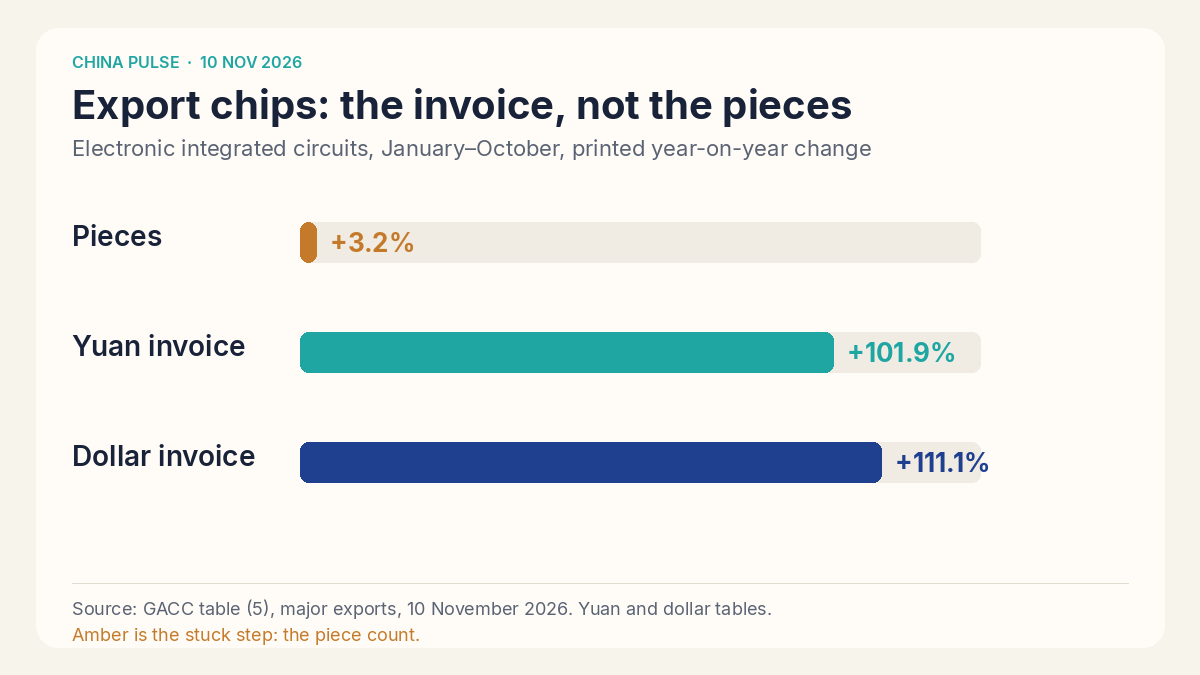
The sellers of integrated circuits that already cleared Chinese customs were paid on the invoice customs recorded. The stuck step is the piece count. From January through October 2026, export pieces rose 3.2% and the dollar invoice rose 111.1%.
CHINA PULSE · Data as at 10 Nov 2026 · Next update: after the November customs tables
Affects: Semiconductors — Markets: China
In short: On 10 November 2026 the General Administration of Customs published preliminary trade tables for October. China declared $39,594.4 million of electronic integrated circuits exported that month, on 26.81 billion pieces. Over ten months the dollar invoice is up 111.1% and the piece count is up 3.2%. The import invoice is the larger cheque, and its piece count is up 6.5%.
Education only, not advice to buy or sell any security. Figures are from the customs tables dated 10 November 2026. Where we divide or subtract printed numbers, the working is labelled our arithmetic. A declared customs value is the statistical invoice on goods that already crossed. It is not a company's revenue and it is not a bank balance.
The numbers that matter this month
The integrated-circuit line got expensive. It did not get much longer.
Tables (5) and (6) count electronic integrated circuits in units of 100 million pieces, and they print value twice, in yuan and in dollars. The cells below are converted only by that unit. 268.1 hundred-million pieces is 26.81 billion pieces. A yuan cell is in CNY 100 million, so 2,677.8 is CNY 267.78 billion. Dollar cells are already in millions of dollars. The year-on-year rates are the rates printed on the ten-month columns. The commodity rows are silent on an October year-on-year rate.
| Electronic integrated circuits | October 2026 | Jan–Oct 2026 | Jan–Oct comparison column | Printed ten-month change |
|---|---|---|---|---|
| Export pieces | 26.81 billion | 302.03 billion | 292.64 billion | +3.2% |
| Export value, dollars | $39,594.4 million | $341,070.3 million | $161,588.6 million | +111.1% |
| Export value, yuan | CNY 267.78 billion | CNY 2,338.08 billion | CNY 1,158.26 billion | +101.9% |
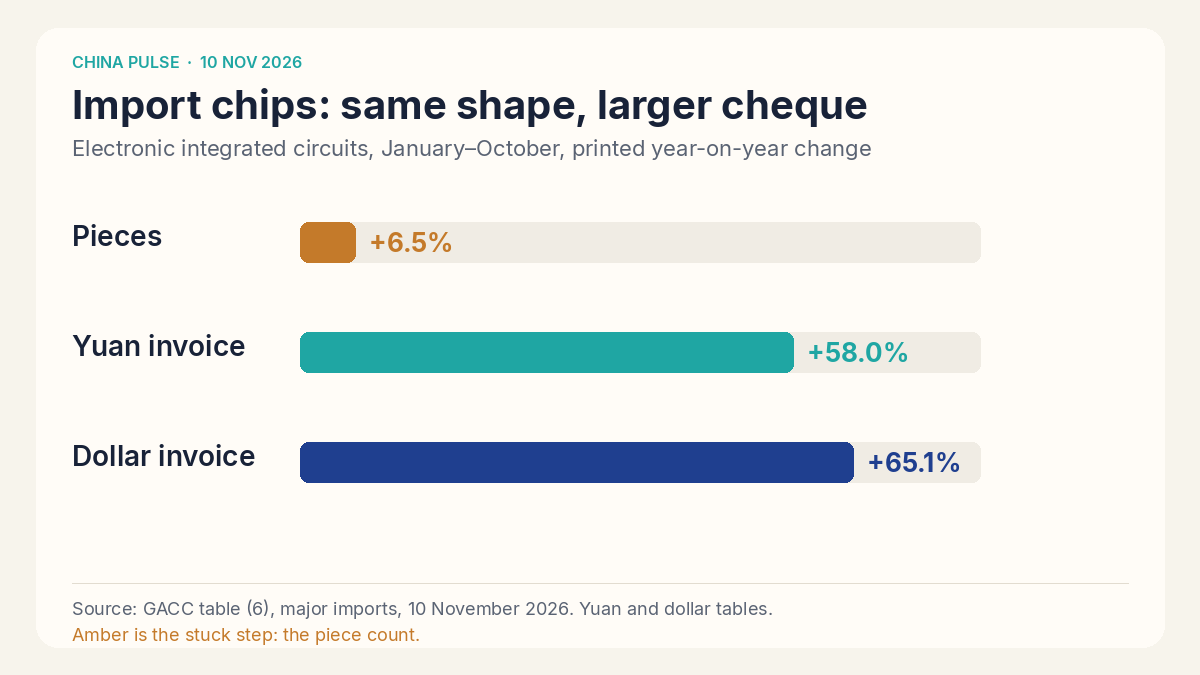
| Import pieces | 50.30 billion | 525.75 billion | 493.83 billion | +6.5% |
| Import value, dollars | $67,352.7 million | $566,519.6 million | $343,113.1 million | +65.1% |
| Import value, yuan | CNY 455.69 billion | CNY 3,886.33 billion | CNY 2,459.34 billion | +58.0% |
The export tables, in yuan and in dollars, title the comparison column 2025. The dollar import table also titles it 2025. The yuan import table titles the same piece count, 4,938.3 hundred-million pieces, as 2024. The printed year-on-year rates sit on that column. We use the dollar page's year, 2025, because the piece counts match and the rate is labelled year-on-year. We keep the yuan rates as printed. A later correction of the column title would be a new print.
The same day's goods totals, table (1), put a denominator under the line. In dollars, October exports were $412.33 billion, down 7.8% from September and up 35.2% from a year earlier. Ten-month exports were $3,782.76 billion, up 22.7%. October imports were $307.05 billion, down 2.2% from September and up 41.6% from a year earlier. Ten-month imports were $2,740.17 billion, up 29.0%. The October goods surplus was $105.28 billion. In yuan, ten-month goods trade was CNY 44,809.99 billion, up 20.0%, with exports up 17.6% and imports up 23.6%. October goods trade was up 31.2% from a year earlier and down 5.7% from September.
Why does China matter now?
China is the place where a large share of the world's chips are declared twice: once on the way in, and once on the way out.
Our arithmetic puts the ten-month export invoice at 9.0% of all goods-export dollars ($341,070.3 million divided by $3,782,760 million). The ten-month import invoice is 20.7% of all goods-import dollars ($566,519.6 million divided by $2,740,170 million). In October those shares were 9.6% of export dollars and 21.9% of import dollars. The yuan shares are close: 9.0% of ten-month export yuan and 20.6% of ten-month import yuan. One commodity line is a fifth of what China declared on the way in.
Goods exports in dollars are up 22.7% over ten months. Integrated-circuit exports in dollars are up 111.1%. Goods imports in dollars are up 29.0%. Integrated-circuit imports in dollars are up 65.1%. The chip line is ahead of the country average, and the gain is in the invoice. Export pieces are up 3.2%. Import pieces are up 6.5%.
The State Council briefing the same day said integrated-circuit and storage-part exports both grew by multiples. Table (5) prints the integrated-circuit rate. It has no storage-parts row, so that half of the sentence stays uncounted here.
What changed
October was a rich month inside a year that was already rich, and it was a slower month for pieces.
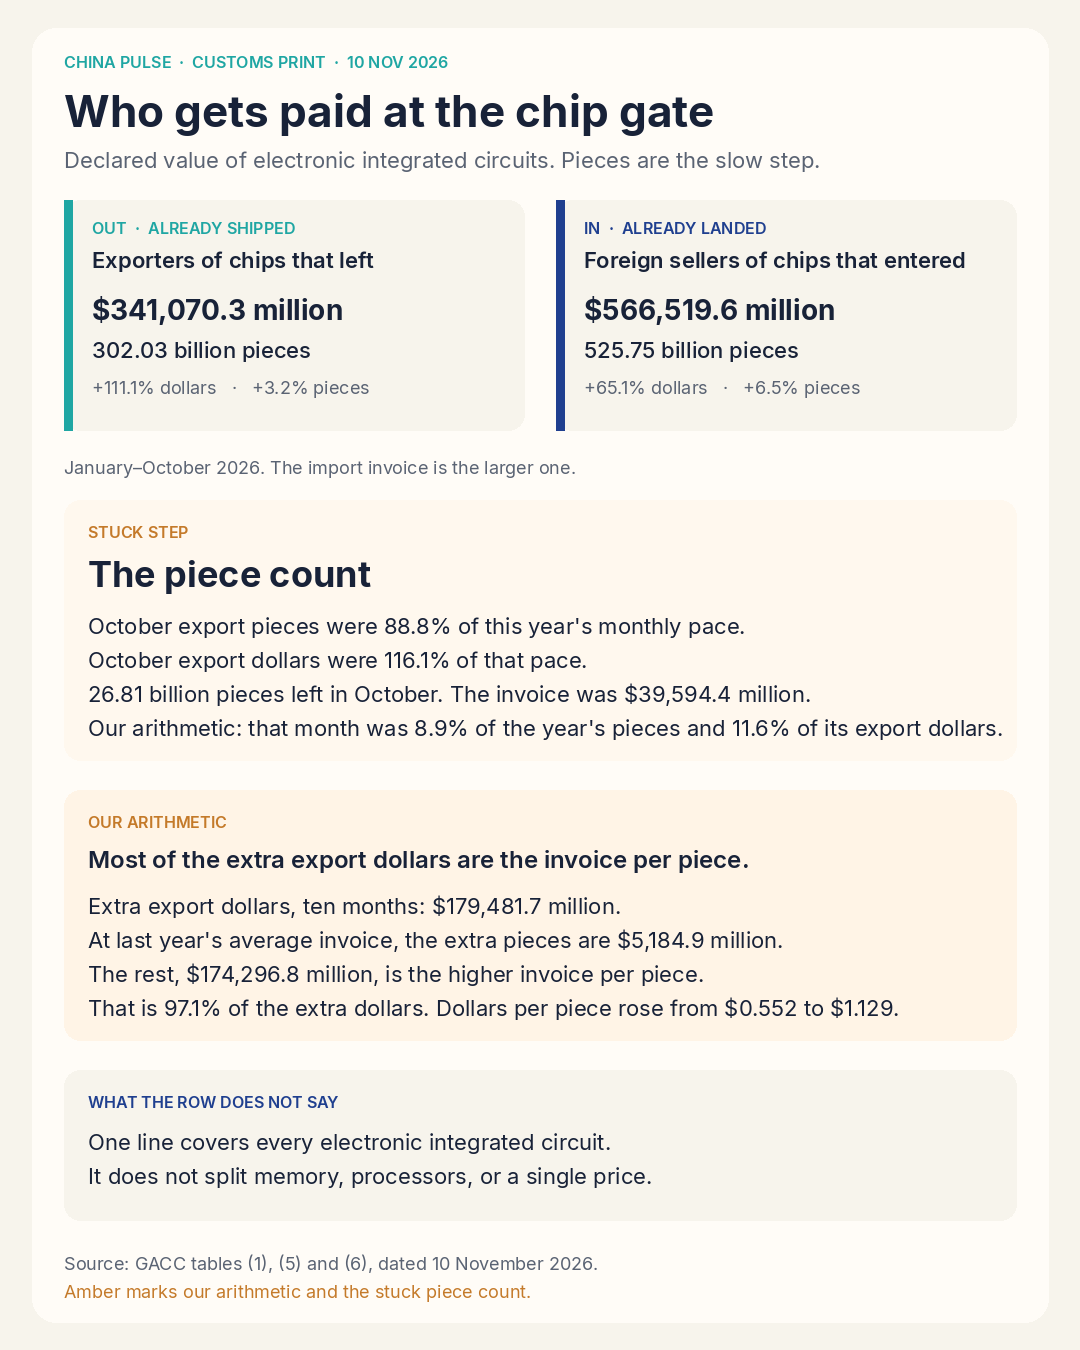
Our arithmetic: the ten-month export pace is 30.203 billion pieces a month (302.03 divided by 10) and $34,107.0 million a month. October delivered 26.81 billion pieces, which is 88.8% of that pace, and $39,594.4 million, which is 116.1% of that pace. October held 8.9% of the year's export pieces and 11.6% of the year's export dollars. A flat month would have held 10% of each.
Imports rhyme. The ten-month import pace is 52.575 billion pieces and $56,652.0 million a month. October brought in 50.30 billion pieces, 95.7% of the piece pace, and $67,352.7 million, 118.9% of the dollar pace. Both gates, in the latest month, ran a little under their own piece pace and well over their own invoice pace.
Table (1) prints October goods exports down 7.8% in dollars and down 8.0% in yuan from September. The integrated-circuit row has no month-on-month column. October is heavy inside the ten-month chip total. Whether the chip invoice itself fell from September is not in the tables.
Neighbouring rows keep this from being every electronics line. Diodes, same piece unit: 436.83 billion pieces over ten months, up 3.8%; dollar value $22,834.7 million, up 13.6%; yuan value CNY 156.91 billion, up 8.9%. Mobile phones: pieces down 9.3%, dollar value up 13.6%. Automatic data-processing machines and parts have no quantity. Their export dollars are up 60.6% and their import dollars are up 136.7%. That line has an invoice and no count. Mechanical and electrical products, and hi-tech products, include the integrated-circuit row. The table note says so. We do not add them on top.
Our math
The extra export dollars are almost entirely a higher invoice per piece. The working below is our arithmetic, from the printed cells, not from the rounded percentages.
Dollars per exported piece equal the dollar cell divided by the piece cell, times 0.01, because dollars are in millions and pieces are in hundred-millions. For 2026 that is 341,070.3 / 3,020.3 × 0.01 = $1.129260. For the 2025 column, 161,588.6 / 2,926.4 × 0.01 = $0.552175. The ratio of those quotients is 2.045, or +104.5%. In yuan, both cells are in units of 100 million, so 23,380.8 / 3,020.3 = CNY 7.741 per piece, against CNY 3.958. That index is 1.956, or +95.6%.
The price index uses the cell ratios, not the rounded percentages. Dollar value 341,070.3 / 161,588.6 = 2.11073, which prints as +111.1%. Pieces 3,020.3 / 2,926.4 = 1.03209, which prints as +3.2%. Then 2.11073 / 1.03209 = 2.045. Yuan value 23,380.8 / 11,582.6 = 2.01861, which prints as +101.9%, and 2.01861 / 1.03209 = 1.956.
| Our arithmetic, export | 2026 ten months | 2025 column | Change |
|---|---|---|---|
| Dollars per piece | $1.129 | $0.552 | +104.5% |
| Yuan per piece | CNY 7.741 | CNY 3.958 | +95.6% |
| Extra dollars, of which | $179,481.7 million | ||
| Extra pieces at last year's invoice | $5,184.9 million | ||
| Higher invoice per piece | $174,296.8 million | ||
The extra dollars are 341,070.3 minus 161,588.6. The extra pieces are 93.9 hundred-million pieces, or 9.39 billion. At last year's $0.552 those pieces are $5,184.9 million. The remainder, $174,296.8 million, is 97.1% of the extra export dollars. In yuan the value gap is CNY 1,179.82 billion, of which CNY 37.17 billion is the extra pieces and CNY 1,142.65 billion is the higher invoice per piece.
Imports, same method. Unrounded dollars per piece are $1.0775 this year and $0.6948 in the comparison column, index 1.551, or +55.1%. Yuan per piece is CNY 7.392 against CNY 4.980, or +48.4%. Extra import dollars are $223,406.5 million. Extra pieces at last year's invoice are $22,178.0 million. The higher invoice per piece is $201,228.5 million, or 90.1% of the extra import dollars.
October's average is higher than the ten-month average. It is not a year-on-year price: the tables are silent on October 2025 for this row. October export dollars per piece are 39,594.4 / 268.1 × 0.01 = $1.477, or 30.8% above the ten-month $1.129. October import dollars per piece are $1.339, or 24.3% above the ten-month $1.078.
The currency gap is our arithmetic from the two value cells, not an official exchange rate. On exports, the dollar value index ran 4.6% ahead of the yuan value index (2.11073 / 2.01861 = 1.046). Implied yuan per dollar on that basket is 6.855 in 2026 and 7.168 in the 2025 column. The import basket gives 6.860 and 7.168. That changes how large the invoice looks in yuan. The piece cell is the same in both currencies, and it is the slow one in both.
Over ten months China imported 1.741 pieces for each piece it exported (5,257.5 / 3,020.3). In October the ratio was 1.876. Average yuan per piece is CNY 7.741 on the way out and CNY 7.392 on the way in. Both rows share a name. The table does not say they are the same product.
Where does the money stick?
It sticks to the declared invoice on chips that have already crossed, and the larger invoice points inward.
Foreign sellers of integrated circuits that already entered China are the party on the bigger number. Ten months of imports are $566,519.6 million. October alone is $67,352.7 million. Exporters of integrated circuits that already left are the party on $341,070.3 million over ten months and $39,594.4 million in October. Our arithmetic subtracts those printed dollars: imports exceed exports by $225,449.3 million over ten months and by $27,758.3 million in October. In yuan the same subtraction is CNY 1,548.25 billion over ten months and CNY 187.91 billion in October.
That net figure is a gap between two declarations. It is not the country's goods surplus, which table (1) puts at $105.28 billion for October and $1,042.59 billion for ten months. The chip line can run a declared deficit while the country runs a goods surplus. Both numbers are in the same release. They answer different questions.
Inside each side, the money sticks to the value per piece. On the way out, 97.1% of the extra dollars are the higher invoice. On the way in, 90.1% are. Customs names no company on the row. Our arithmetic on diodes, in the same book, takes the dollar value ratio of 1.136 down to a price index of 1.094 after the 3.8% piece gain, or +9.4% per piece. The integrated-circuit invoice per piece roughly doubled.
Is the piece count still stuck?
Yes. The 10 November print still shows a slow count, and October made the count slower than the year already was.
Export pieces are 3.2% above the 2025 column after ten months. October's 26.81 billion pieces are 88.8% of this year's own monthly pace. Import pieces are 6.5% above the comparison column, and October's 50.30 billion pieces are 95.7% of their pace. The invoices, in the same month, were 116.1% and 118.9% of their dollar paces. The latest month did not unblock the count. It concentrated the invoice.
The tables record a large count that did cross: 26.81 billion pieces out and 50.30 billion in, in October alone. Stuck, on this print, means the count was not the column that grew. A memory die, a microcontroller, and a processor each count as one piece. A shift toward the dearer piece raises the average with no change in any single price. Until a split exists, the stuck step this table can show is the count.
What dates matter
The hard date is the one on the tables. Customs has not posted the day of the November set.
| Date | What lands | What would matter |
|---|---|---|
| 10 Nov 2026 | October preliminary tables (1), (5) and (6) | This pulse. Piece count versus invoice. |
| After verification | The monthly bulletin | Customs says the bulletin is the more accurate set once the preliminary numbers are checked. |
| November tables | The next preliminary release | Whether pieces start to follow the invoice. This set is dated the 10th. A September trade-mode table is dated 15 October. The next day is not posted. |
| Any later split | A memory, processor, or other breakout inside this row | Whether the higher invoice per piece is a price or a mix. |
The preliminary-release page says that after verification the monthly bulletin is the more accurate set. A revision that moves the piece cell and the value cell by different amounts would change the index. A revision that scales both cells together would not.
How is this different from a foundry quarter?
A foundry quarter is one company's wafers and sales. This print is a border count with no company on it.
The Hua Hong pulse read a foundry's own quarter: wafers, utilization, and sales that company recognized. This customs row does not name Hua Hong and does not print utilization. Wafers that stay in China never appear as export pieces. The Taiwan revenue pulse is one foundry's monthly sales, recognized on that company's clock. A record month there does not have to show up as a record piece count at this border.
In this same release, diodes repriced modestly, phone pieces fell, and computer machines jumped in dollars with no piece count. The integrated-circuit line is the one where both a count and an invoice exist and diverge this sharply.
What would change this view?
The view is that the invoice was paid and the piece count is still the stuck step. It would weaken if:
- The monthly bulletin revises the ten-month piece cell up enough that the count, not the invoice, accounts for the value gap.
- The November tables show piece growth in line with value growth, on either side of the gate.
- A published split of this row shows the extra dollars are a different product, with its own piece count, rather than a higher invoice on a similar basket.
- Customs resolves the yuan import column title as a true 2024 base. The dollar page would still stand. The yuan year-on-year label would not.
- A company print shows units shipped inside China rising sharply while this border count stays flat. That would move the stuck step from the gate to demand or inventory inside the country, which these tables do not show.
The view stays intact while the next tables still show a small piece change beside a large value change, on an unsplit row.
Practical takeaways
- Export pieces are +3.2% over ten months. Export dollars are +111.1%.
- The larger invoice is imports: $566,519.6 million in, $341,070.3 million out.
- Our arithmetic: $174,296.8 million of the extra export dollars is the higher invoice per piece. $5,184.9 million is the extra pieces.
- October export pieces were 88.8% of this year's monthly pace. October export dollars were 116.1% of theirs.
- The row names no company and no memory-versus-logic split. Dollars per piece are an average.
- Diodes, same book: dollar invoice +13.6% on 3.8% more pieces.
FAQ
Who gets paid on China's October chip invoice?
Foreign sellers of integrated circuits that already entered China, and exporters of integrated circuits that already left. October's import declaration is $67,352.7 million and the export declaration is $39,594.4 million, a statistical invoice on goods that cleared.
Why is the piece count the stuck step?
Because the count barely moved while the invoice did. From January through October, export pieces rose 3.2% and the dollar invoice rose 111.1%. Import pieces rose 6.5% and the dollar invoice rose 65.1%.
How many integrated circuits did China export in October 2026?
26.81 billion pieces, which is the table cell 268.1 in units of 100 million pieces. The declared value of those pieces was $39,594.4 million, or CNY 267.78 billion. The commodity table does not print an October year-on-year rate for the row.
Did China import more chips than it exported?
Yes, on both pieces and dollars. October imports were 50.30 billion pieces and $67,352.7 million, against exports of 26.81 billion pieces and $39,594.4 million. Our arithmetic puts the October dollar gap at $27,758.3 million and the ten-month dollar gap at $225,449.3 million.
What would show that the higher invoice is mix rather than the same chip?
A customs split of electronic integrated circuits into memory, processors, and other chips, each with its own piece count and value. This table prints one row. The average dollars per piece can rise because the basket changed, and the table cannot separate that from a higher price on an unchanged basket.
Keep reading on the map
- This door: China · Hua Hong's specialty slots
- Sibling doors: Taiwan · TSMC revenue and the packaging gate · Korea · United States
- The stack: Semiconductors
How we check this
Piece counts and values are tables (5) and (6), dated 10 November 2026, in yuan and in dollars. Goods totals are table (1). The storage-parts line is the State Council page. The bulletin note is the preliminary-release page. Where a table is silent, the piece says so. Every subtraction and division is labelled our arithmetic.
Last reviewed: 12 Nov 2026 · Next review: when customs publishes the November preliminary tables, or sooner if the October bulletin revises the integrated-circuit cells.
References
- General Administration of Customs, table (5), China's major exports by quantity and value, October 2026, in yuan. Electronic integrated circuits, diodes, phones, and automatic data-processing machines. Dated 10 November 2026. Export table, yuan
- General Administration of Customs, table (5), the same exports in dollars. Dated 10 November 2026. Export table, dollars
- General Administration of Customs, table (6), China's major imports by quantity and value, October 2026, in yuan. The comparison column on this page is titled 2024. Dated 10 November 2026. Import table, yuan
- General Administration of Customs, table (6), the same imports in dollars. The comparison column is titled 2025. Dated 10 November 2026. Import table, dollars
- General Administration of Customs, table (1), China's total export and import values, October 2026, in yuan. Dated 10 November 2026. Goods totals, yuan
- General Administration of Customs, table (1), the same totals in dollars. Dated 10 November 2026. Goods totals, dollars
- General Administration of Customs, preliminary-release note: after verification, the monthly bulletin is the more accurate set. Preliminary release
- State Council, 10 November 2026, citing customs: ten-month goods trade and the line that integrated-circuit and storage-part exports grew by multiples. The storage-part amount is not in table (5). State Council briefing