
GPU Rental Price Explained: What Sets the Price of an H100 Hour
A GPU rental price is what a cloud charges for one graphics processor for one hour. An H100 cleared at $2.92 on 29 October 2026, but only the hours not already sold on contract earn that price.
EXPLAINED · Mechanism · Last reviewed: 30 Oct 2026 · Next review: after the October month-end index readings (2 Nov 2026)
A GPU rental price is what a cloud provider charges to use one graphics processing unit, or GPU, for one hour. It is quoted in US dollars per GPU-hour.
In short. A GPU rental price is dollars per GPU per hour. On 29 October 2026 an Nvidia H100 cleared at $2.92 an hour on Ornn’s index of executed trades, while listed rates ran from about $3.20 at specialist clouds to $9.90 at the hyperscalers. The price that moves each day is set by the spare hours: GPUs that are live but not yet sold on contract. Our read: the owner of those spare hours is paid first when rent rises; hours locked into multiyear deals wait for renewal. The stuck step is live, unsold capacity, and there is not much of it.
Why an investor cares: the hourly rent on a GPU is the top line of every neocloud and the number every GPU lender checks before it lends. When it rises, spare capacity is worth more; when it falls, a GPU bought on borrowed money takes longer to pay back. Our guide to neoclouds covers the companies that sell these hours; this page covers how the price is set.
What is a GPU rental price?
It is the price of one GPU for one hour. AI companies rarely buy single chips to train or run a model; they rent servers full of them, usually eight GPUs to a server, and the bill is worked out per GPU per hour. A cluster of 1,000 H100s rented for a day is 24,000 GPU-hours.
The price depends on four things: which chip, how long the buyer commits for, how many GPUs are joined together, and how fast the network between them is. An H100 rented for one hour on a single server is a different product from an H100 inside a 4,000-GPU cluster signed for three years. Our explainer on GPU as a service covers what the buyer gets for the hourly fee.
How much does it cost to rent an H100 per hour?
About $2.90 to $3.40 at the specialist clouds in late October 2026, depending on which number you read. Ornn, which records rentals actually agreed between buyers and sellers, settled its H100 index at $2.92 on 29 October. That is $70.08 per GPU per day, or about $2,102 a month.
Silicon Data’s neocloud benchmark read $2.90 the same day. The two sites that read prices listed on provider websites came in higher: GPU Economy’s weekly median was $3.39 across 38 providers, and GPU Rental Prices put the typical on-demand H100 at $3.30 for October. The cheapest listed H100 it found in the month was $1.80.
| Index | What it measures | H100, late Oct 2026 | Move |
|---|---|---|---|
| Ornn OCPI-H100 | Executed trades of GPU hours, settled daily | $2.92 (29 Oct) | +7.7% in October to date; −8.8% in September |
| Silicon Data SDH100RT | Neocloud quotes standardised for term, cluster size and interconnect | $2.90 (29 Oct) | Up from $2.75 on 30 Sep |
| GPU Economy | Median of rates listed on provider websites, weekly | $3.39 (week of 26 Oct, provisional) | Down from $3.92 in the week of 7 Sep |
| GPU Rental Prices | Typical cheapest on-demand rate per provider, averaged over the month | $3.30 (October average) | +2.9% on September |
Each index’s own published reading, on the dates shown. Full source list at the end of the page.
Hyperscalers charge far more on their list prices. GPU Economy put the median listed H100 at the four big clouds at $9.90 an hour in the week of 26 October, against $3.23 at specialist GPU clouds. Our arithmetic: that is about three times the specialist rate.

Why do the price indices disagree?
Because a listed price is an asking price and a trade is what someone paid. Listed rates sit on a provider’s website for anyone to click; they are often for small amounts, with no commitment, and they change only when the provider edits the page. A trade records a real deal, which can be larger, longer or done at a discount to the list.
The gap is clearest on the newer chips. On 29 October Ornn’s executed-trade index had the H200 at $5.96 an hour, Silicon Data’s standardised reading had it at $3.48, and GPU Rental Prices’ October list average was $4.73. Three honest measures, three numbers, because each one counts a different slice of the market.
Our read: use executed trades for what the market is paying today, standardised benchmarks for comparing like with like over time, and list prices for what a small buyer would pay on the day. Never compare a trade index with a list index and call the difference a price move.
What sets the price of a GPU hour?
Supply of live GPUs that are not already sold, and demand from buyers who need them now. Silicon Data says H100 rents move with new clusters and provider capacity coming online, the pace at which work moves to newer chips, and the mix of on-demand and reserved deals.
Most GPU hours never reach the daily market. Large clusters are usually signed for one to several years before they are switched on, often on take-or-pay terms where the buyer pays whether it uses the hours or not. Our explainer on take-or-pay GPU contracts covers how those deals work. What is left over, the spare hours, is what gets rented on demand and what the indices mostly track.
So a small change in spare supply can move the price a lot. A new cluster that comes online without a buyer adds spare hours and pushes the rate down. A large buyer that signs up everything a provider has left removes them and pushes the rate up. Our explainer on reserved vs on-demand GPUs covers who carries the idle hour in each kind of deal.
Why are GPU rental prices rising in October 2026?
Ornn’s H100 index rose 7.7% in October to date after an 8.8% fall in September, ending the month near August’s level. The bigger moves were on the newer chips: its H200 and B200 indices each rose about 21% in a month, to $5.96 and $9.83. GPU Rental Prices’ listed averages show the same direction, with the H200 up 10.9%, the B200 up 14.3% and the B300 up 15.0% on September.
| GPU | Executed trades (Ornn, 29 Oct) | One-month move | Listed on-demand (October average) |
|---|---|---|---|
| A100 (2020) | $1.09 | +18.5% | $1.87 |
| H100 (2022) | $2.92 | +6.6% | $3.30 |
| H200 (2024) | $5.96 | +20.6% | $4.73 |
| B200 (2025) | $9.83 | +20.8% | $7.71 |
Executed-trade prices from Ornn’s Compute Price Index; listed on-demand averages from GPU Rental Prices’ October reading. Years are when each chip first shipped in volume, approximately.
Old chips rose too. The A100, first shipped in 2020, traded at $1.09 an hour on 29 October, up 18.5% in a month on Ornn’s index. When the oldest GPUs in the market get dearer, the usual reading is that buyers are taking whatever is live. Our Wire on Nebius raising on-demand GPU prices covers one provider that moved its list prices up from 1 October.
A longer view is calmer. GPU Economy’s weekly median listed H100 rate fell from $3.92 in the week of 7 September to $3.39 in late October, as more providers listed the chip at lower prices. Over the same weeks the number of providers in its count rose from 18 to 38, and cheaper sellers joining pull a median down. The list price of an older chip can drift lower even while the rate actually traded is rising.
How much does one GPU earn in a year?
Our arithmetic: a GPU-hour price times the hours sold. At $2.92 an hour and every hour of the year sold, one H100 bills about $25,600. At 70% of hours sold, it bills about $17,900. A 1,000-GPU cluster at full use bills about $25.6 million a year.
The sensitivity is simple. Each 10 cents an hour is worth $876 a year per GPU at full use, or $876,000 a year on 1,000 GPUs. That is why the share of hours sold matters as much as the price. Our explainer on GPU utilization covers why an idle hour earns nothing.
The owner then has to cover the chip, the server, the power and the hall over the GPU’s useful life, and pay its lenders. Our guide to GPU depreciation covers how long that life is assumed to be, and our guide to GPU financing covers the loans that draw down as the GPUs go live.
Who gets paid, and where is the stuck step?
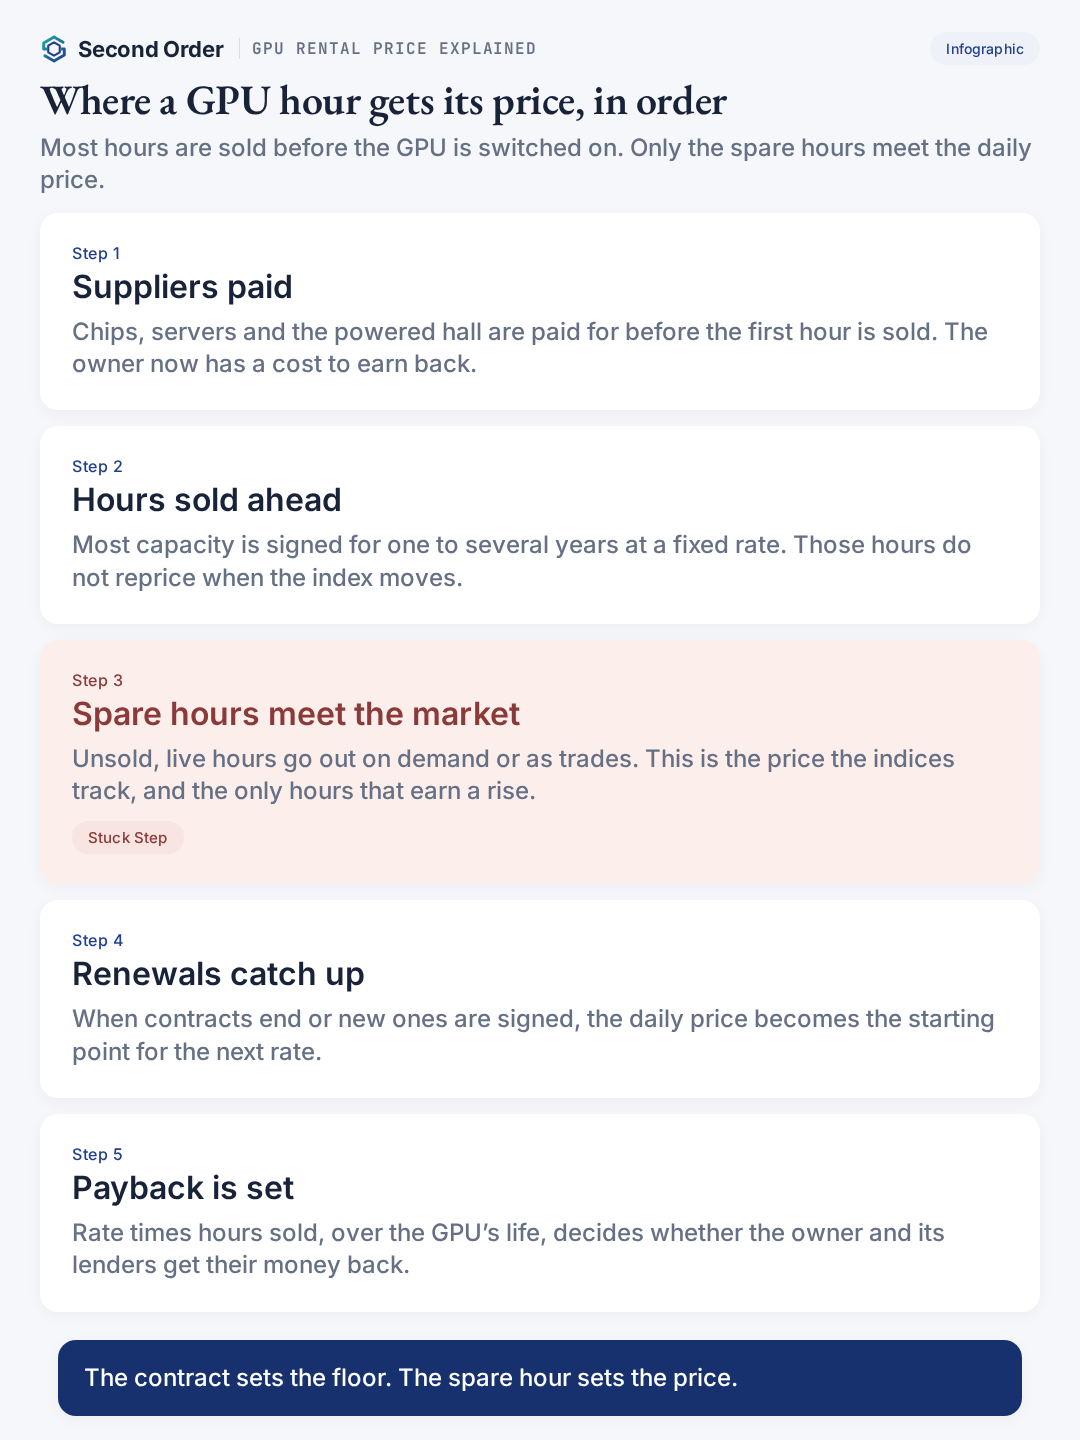
The suppliers are paid first: Nvidia for the chip, the server builders, and the firms that build and power the hall. They are paid when the GPUs are bought, before any hour is rented, whatever the index does next.
Next is the owner of spare hours. A neocloud or reseller with live GPUs that are not yet sold captures a rising index straight away, through on-demand sales or short trades. Our guide to who the neoclouds are covers the companies with the most of these hours.
Hours already sold on multiyear contracts are paid last for a price rise. They keep the agreed rate until the contract ends. If the index is higher at renewal, the next contract starts higher; if it is lower, the owner takes the cut then.
The stuck step is live, unsold capacity. A higher rent pays only on GPUs that are installed, powered, networked and not already spoken for, and new halls take a year or more to come online. Our Neoclouds layer tracks how each company turns capacity into billed hours.
What would change the view?
- A wave of new capacity. If large Blackwell clusters come online without buyers already signed, spare hours rise and the daily price falls, starting with the newest chips.
- Big buyers sign up the spare hours. If AI labs keep taking capacity on long contracts, less reaches the daily market and the index can keep rising on thin trade.
- Cheaper ways to run models. If inference work moves to custom chips or gets more efficient per token, demand for rented GPU hours grows more slowly than the halls being built.
What to check next
The October month-end readings come next: Ornn’s last October settle on Friday 30 October at 4 p.m. New York time, which is 4 a.m. on Saturday in Singapore, and GPU Rental Prices’ final October figures after its 31 October reading. Watch whether the H200 and B200 hold their 21% gains or give them back. Our explainer on AI tokens vs GPU hours covers the other way AI capacity is priced, by the token.
Common misconceptions
- People assume there is one GPU price. Actually the same H100 hour was $2.92 as an executed trade, $3.39 as a median list price and $9.90 at a hyperscaler in the same week.
- People assume a rising index lifts every neocloud’s revenue. Actually hours already sold on multiyear contracts keep their rate; only spare and renewing hours reprice.
- People assume older GPUs only get cheaper. Actually the A100 traded 18.5% higher in a month to 29 October, six years after it first shipped.
- People assume the list price is what big buyers pay. Actually large clusters are signed on negotiated multiyear terms that rarely appear on any website.
FAQ
How much does it cost to rent an H100 per hour?
About $2.90 to $3.40 at specialist GPU clouds in late October 2026. Ornn’s index of executed trades settled at $2.92 on 29 October, Silicon Data’s neocloud benchmark read $2.90, and the median listed on-demand rate tracked by GPU Economy was $3.39. Hyperscalers listed the H100 at a median $9.90.
Why do GPU price indices show different numbers?
Because they measure different things. One records trades that actually happened, one standardises quotes for term and cluster size, and two read the prices providers list on their websites. A listed rate is an asking price; a trade is what a buyer paid.
Are GPU rental prices going up or down?
Up in October 2026. Ornn’s H100 index rose 7.7% in the month to 29 October after falling 8.8% in September, and its H200 and B200 indices rose about 21% in a month. Over a longer run, GPU Economy’s weekly median listed H100 rate fell from $3.92 in early September to $3.39.
How much does one GPU earn in a year?
Our arithmetic: at $2.92 an hour and every hour sold, one H100 bills about $25,600 a year. At 70% of hours sold it bills about $17,900. Each 10 cents an hour is worth $876 a year per GPU at full use.
Why are hyperscaler GPU prices so much higher?
Hyperscalers list on-demand GPUs inside a full cloud with storage, networking and support, and most large buyers pay negotiated rates rather than the list price. GPU Economy found the hyperscaler median list price 207% above specialist clouds in the week of 26 October.
Does a higher GPU rental price help every neocloud?
No. Hours already sold on multiyear contracts keep their agreed rate until the contract ends. A higher index helps the owner of hours that are still unsold or come up for renewal.
Is this a list of stocks to buy or sell?
No. This page explains how GPU rental prices are set and measured. It does not rank companies or give buy or sell calls. Not investment advice. Do your own research.
Related: reserved vs on-demand GPUs; take-or-pay GPU contracts; GPU utilization; GPU cloud providers; neocloud vs hyperscaler; Nvidia cloud partners.
Stack doors
Layer: Neoclouds. Also: CoreWeave, Nebius and Lambda. Markets: US.
Get the Wire — short daily notes when GPU rents and neocloud contracts move.
Not investment advice. Do your own research.
How we check this
Prices come from the four indices’ own public pages, read on 29 and 30 October 2026 and dated in the list below. We did not buy or sell GPU hours to test them. The yearly billing figures, the per-10-cent figure and the hyperscaler-to-specialist ratio are our arithmetic from those prices and are labelled as ours on the page. The order of who gets paid, and the stuck step, are our read. The featured photograph is credited in its caption. This page explains how GPU rental prices work. It does not rank companies or give buy or sell calls. Not investment advice. Do your own research.
Last reviewed: 30 Oct 2026 · Next review: after the October month-end index readings (2 Nov 2026)
Spot an error? Tell us and we will correct it and note the change here.
References
- Ornn — H100 SXM Price Index (OCPI-H100), settle of 29 Oct 2026 — $2.92 per GPU-hour from executed compute trades, settled daily at 4 p.m. ET; 30-day range $2.52–$3.57; October to date +7.7% on September’s $2.71 month-end; September −8.8%; August month-end $2.97; posted on-demand rates at four clouds $3.49–$6.16
- Ornn — Compute Price Index, current GPU rental prices (29 Oct 2026) — H200 $5.96 (+20.6% in a month), B200 $9.83 (+20.8%), A100 $1.09 (+18.5%); H100 $2.92 equals $70.08 a GPU-day and about $2,102 a GPU-month
- Silicon Data — H100 Rental Price Index, SDH100RT (29 Oct 2026) — neocloud benchmark $2.90 per GPU-hour, up from $2.75 on 30 Sep 2026; standardised for rental term, cluster scale and interconnect; hyperscaler pricing published as a separate reading; related readings H200 $3.48, B200 $6.47, B300 $7.56, A100 $1.56
- GPU Economy — Cloud GPU Price Index, week of 26 Oct 2026 (provisional, read 30 Oct) — median listed on-demand H100 rate $3.39 from 40 rates at 38 providers; middle half $2.99–$4.09; specialist GPU clouds $3.23 against hyperscalers $9.90; weekly median $3.92 in the week of 7 Sep 2026
- GPU Rental Prices — GPU Rental Price Index, October 2026 to date (read 1–29 Oct) — typical on-demand H100 $3.30 an hour, +2.9% on September’s $3.20; H200 $4.73 (+10.9%); B200 $7.71 (+14.3%); B300 $9.18 (+15.0%); lowest listed H100 $1.80