$85B a Year: Who Gets Paid as US Data-Hall Building Sets a Record
US data-center construction ran at a record $84.95 billion yearly pace in August 2026, up 73.2% on a year ago, Census data show. Builders get paid as the halls go up. The servers are not in that number. The stuck step is power: the grid side is growing far slower than the halls.
The US is building data halls faster than ever. Private data-center construction ran at an $84.95 billion yearly pace in August 2026, per Census data out on 1 Oct. That is 73.2% more than a year ago. Who gets paid is plain: the builders, as the work goes in. The stuck step is power. The halls are going up much faster than the power to switch them on.
US PULSE · Data as at 6 Oct 2026 · Next update: after the Census September construction print (2 Nov 2026)
Affects: Hyperscalers · Neoclouds · Semiconductors — Markets: US · Taiwan · Korea · China
Education only, not advice to buy or sell any security. Census figures are labelled as reported and are early estimates that can be revised. Survey and forecast figures come from the named press reports.
The numbers that matter this month
Data-center building, Aug 2026 (Census)
$84.95B
Yearly pace · +7.5% on July · +73.2% on a year ago
PrimaryShare of private non-housing building
~11%
$84.95B of $773.0B · was ~6% a year ago (our arithmetic)
PrimaryChip and electronics factory building
$52.3B
−45.2% from $95.4B a year ago
PrimaryPrivate electric-power building
$141.2B
+10.8% in a year — far slower than the halls
PrimaryPower to switch halls on
Still the bind
Halls +$35.9B in a year; electric +$13.8B (our arithmetic)
Stuck stepGoldman US capacity view
64 GW / 90 GW
End-2026 raised 5 GW · end-2027 cut 5 GW (Reuters, 5 Oct)
ReportedContractor backlog with data-center work
9.9 months
vs 8.3 months without (ABC survey, via ENR)
ReportedSources: US Census Bureau, Construction Spending and private detail tables, 1 Oct 2026; Reuters, 5 Oct 2026; ENR, 1 Oct 2026. Status chips are Second Order’s read.
On this page: Why the US? · What changed · Our math · Where money sticks · Is power still stuck? · Dates next · How this differs · What would change this · FAQ
Why does the US matter now?
Because most of the world’s big AI halls are being built in the US. Every chip needs a building, cooling and power before it can do any work. The Census number tells you how much of that building is actually happening.
It is a useful number for one reason. A plan is a hope. A signed lease is a promise. Work done on a site is money already spent. Census counts the last one: concrete poured, steel raised, wires pulled. So this is close to cash for the people doing the work.
This sits on the same map as Hyperscalers, explained, the Hyperscalers stack and the US Markets hub. The question this month is not “is the US building more halls?” It plainly is. The question is who gets paid while the halls go up, and what stops them earning once they are built.
1 · Halls go up (Census 1 Oct)
Who: Builders and trades
Paid: $84.95B yearly pace of work in August; +73.2% in a year
2 · Power still waits
Who: Grid, substations, plants
Paid: Private electric-power building +10.8% — far slower than the halls
3 · Owners earn later
Who: Cloud companies and developers
Paid: Shell paid now; chips not in the number; money back only when live
What changed in August?
Three things changed. The size, the speed and the mix.
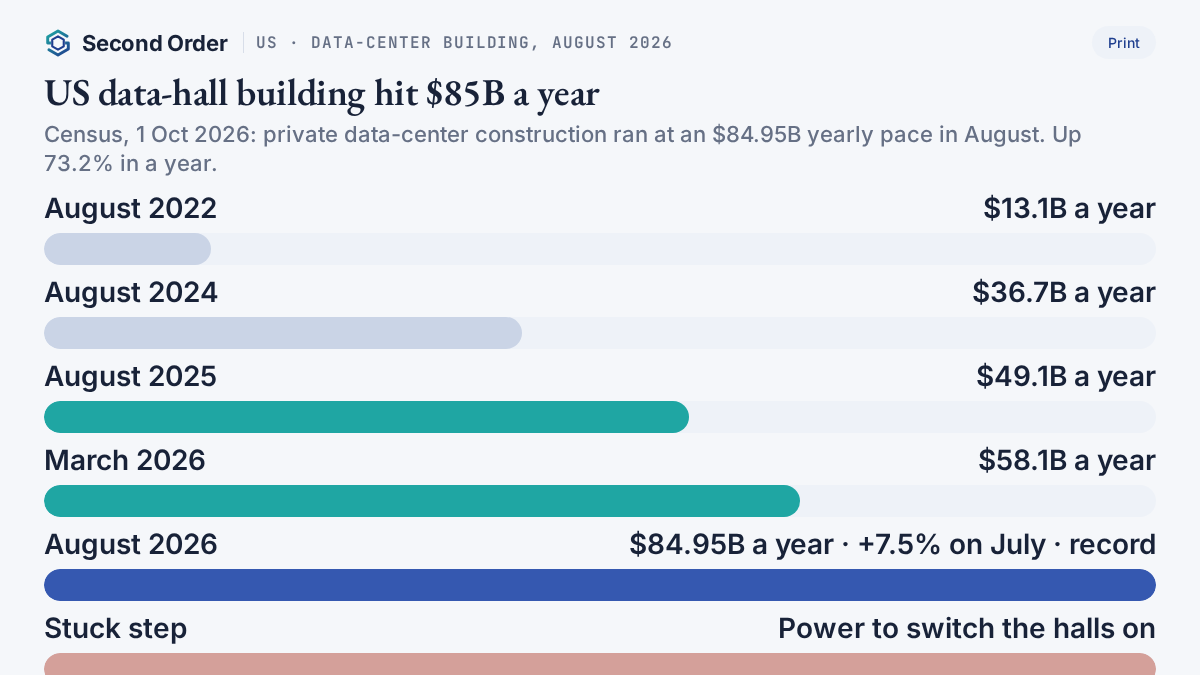
The size. Data-center building ran at an $84.95 billion yearly pace in August. In August 2022 it was $13.1 billion. That is about 6.5 times bigger in four years, by our arithmetic. It is the highest reading since Census started the line in 2014.
The speed. The pace was $58.1 billion in March. Five months later it was $84.95 billion. That is up about 46%, by our arithmetic. The builders’ group ABC put it another way: a 149% annualized pace since March. ABC’s chief economist, Anirban Basu, said: “Frankly, it’s becoming difficult to contextualize the size and speed of this boom.”
The mix. The rest of US building is not booming. Total construction was 1.7% below a year ago. Private non-housing building rose $8.0 billion of yearly pace from July to August. Data halls supplied $5.9 billion of that, or about three-quarters, by our arithmetic. Take data halls out, and private non-housing building is about 5.9% smaller than a year ago.
August 2026 at a glance (Census, yearly pace)
The data-hall line over time (Census)
US Census Bureau, release CB26-158 and private detail tables, 1 Oct 2026. Seasonally adjusted annual rates. August is a first estimate; July and June were revised.
Our math: what is in the $85 billion?
A fair question. Is $85 billion the cost of the AI boom? No. It is only the building part. Here is what Census puts in and leaves out, and the sums we did. This is our arithmetic where marked.
- In: materials, labour, contractor profit, design and engineering, and interest and taxes paid during building.
- In: electrical work, central air conditioning and emergency backup power inside the site.
- Out: racks and servers in data centers. Out: the land. So the chips are not in this number.
- $84.95B ÷ 12 ≈ $7.1B of work a month at August’s pace (our arithmetic).
- $84.95B ÷ $49.05B = 1.73, so up 73.2% in a year.
- $84.95B ÷ $773.0B ≈ 11% of private non-housing building. A year ago, $49.05B ÷ $780.4B ≈ 6% (our arithmetic).
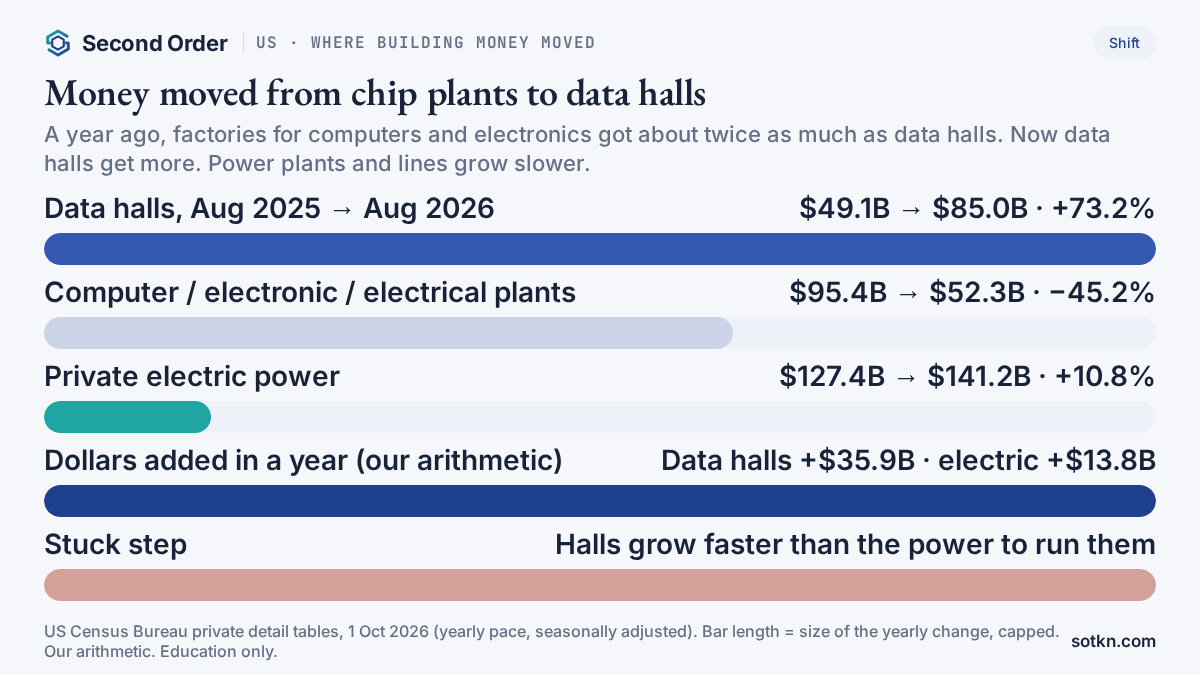
Now the shift. A year ago, factories for computers, electronics and electrical gear took $95.4 billion of yearly building pace. That is where the big US chip plants sit. Data halls took $49.1 billion. So the factories got about twice as much.
In August the order flipped. Data halls $84.95 billion. Those factories $52.3 billion, down 45.2%. Data halls have been ahead every month since April. The money moved from building chip plants to building rooms for the chips.
One caution. These are yearly paces, not money already spent this year. They are also first estimates. Census often revises them, and the August number will move.
Where does the money stick?
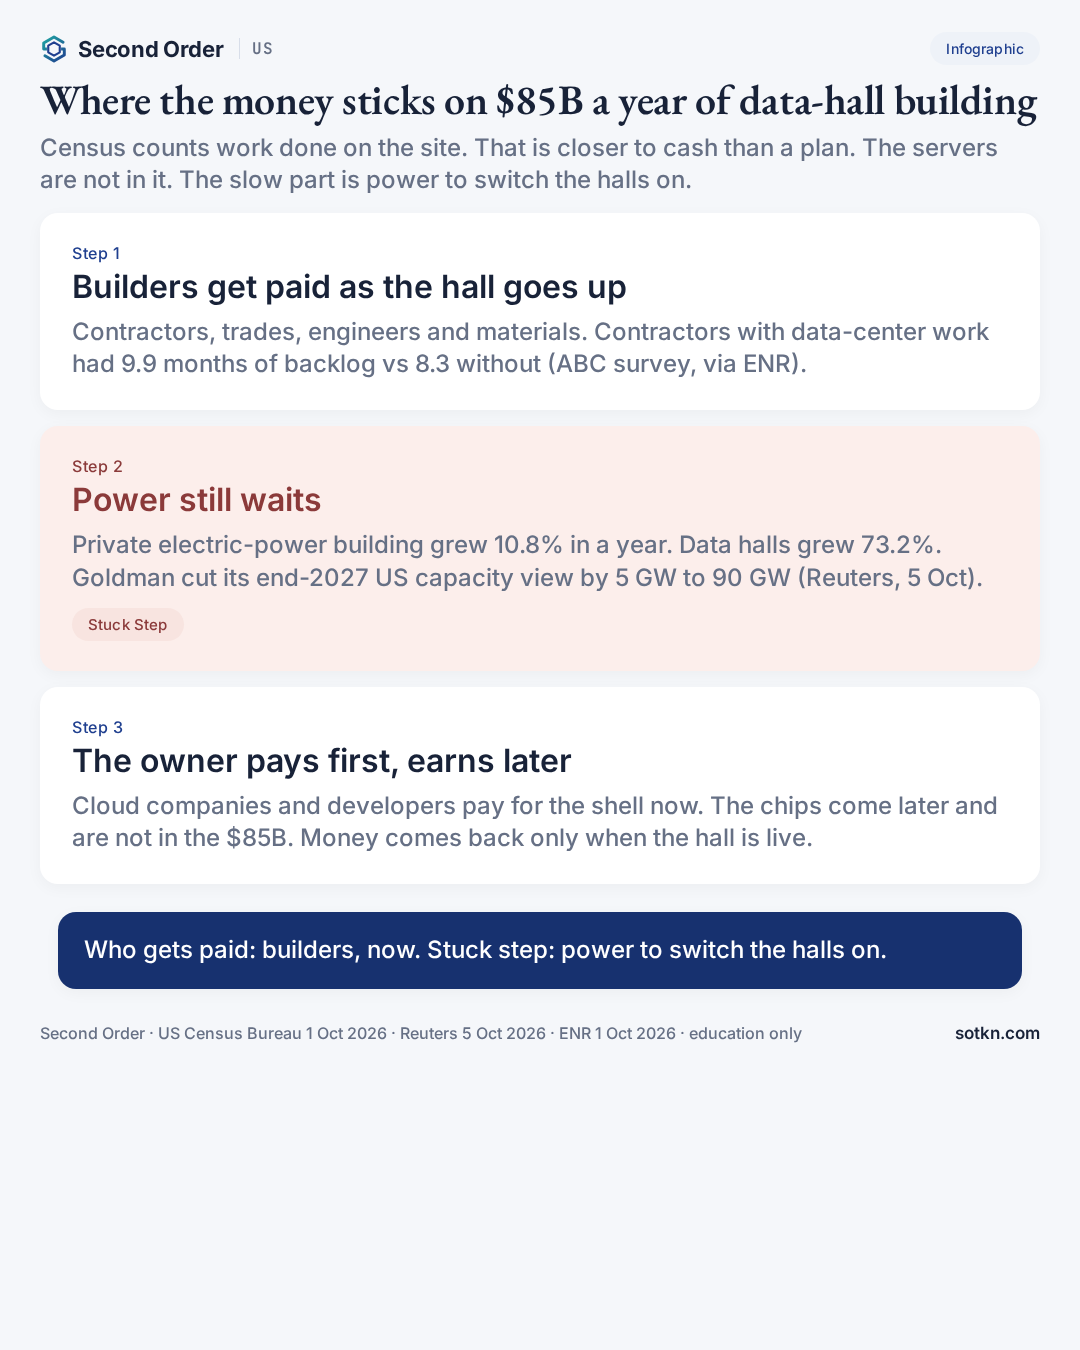
Follow the bill. A cloud company or a developer signs a building contract. Work starts. Each month, Census counts the value of what went in. Who gets paid at each step?
First, the builders. General contractors, electricians, mechanical trades, engineers and material suppliers get paid as the work is done. Contractor profit is part of the Census number. An ABC survey released 15 Sep found about one in six member contractors had data-center work under contract, the highest share it has recorded. Those contractors reported 9.9 months of backlog in August. Contractors without that work had 8.3 months.
Second, the workers. Skilled trades are getting scarcer. In an AGC-NCCER survey, 28% of firms said they did data-center work in the past year. Of those, 58% said it made it harder to hire skilled workers.
Third, the owners. They pay first and earn later. The shell is paid for as it goes up. Then the chips are bought, which is a separate bill — see the US chip is three cheques Pulse and our cash capex explainer. The owner gets money back only when a customer is using the hall and paying for it.
Builders are near the front of the pay line. Owners are at the back. Between them sits one step that has to happen before any of it earns.
Is power still the stuck step?
Yes. A record month for halls does not mean the power is there. It suggests the gap is getting wider.
Look at the two lines side by side. Private electric-power building rose 10.8% in a year, to a $141.2 billion pace. Data halls rose 73.2%. In dollars, the halls added $35.9 billion of yearly pace. Electric power added $13.8 billion (our arithmetic).
The electric line is not all for data centers. It covers power plants, substations, transformers and lines for everyone. So the true gap for data halls is hard to measure. But the direction is clear. Buildings are getting ahead of the power that runs them.
Goldman Sachs sees the same clock. On 5 Oct, Reuters reported Goldman raised its end-2026 US data-center capacity forecast by 5 GW to 64 GW. It cut its end-2027 forecast by 5 GW to 90 GW. It sees data-center power demand rising 38%, or 12 GW, in 2026 and 38%, or 17 GW, in 2027. More now, less later: some of the later build looks slower than it did.
There is a local side too. In a June Reuters/Ipsos poll, only 14% would support a data center in their own community. Goldman said opposition has had limited near-term impact so far. But permits and hookups are local decisions.
We have seen this step before. Our FERC Joliet Pulse looked at one large hookup waiting on the grid. Our CoreWeave Vera Rubin Pulse said it plainly: halls being poured is not halls energised. The Applied Digital 75 MW Wire shows what the other end looks like: a hall that is actually live.
Two cautions before you read “record building” as “problem solved”:
- Built is not live. A finished shell with no power earns nothing for the owner.
- Live is not paid. A powered hall still needs chips and a paying customer before cash comes back.
If power catches up, the stuck step can move — to chips, memory or workers. See Where does the stuck step move? and, for one way owners are trying to buy their own power, the Wire on Oracle and Point Beach.
What dates matter
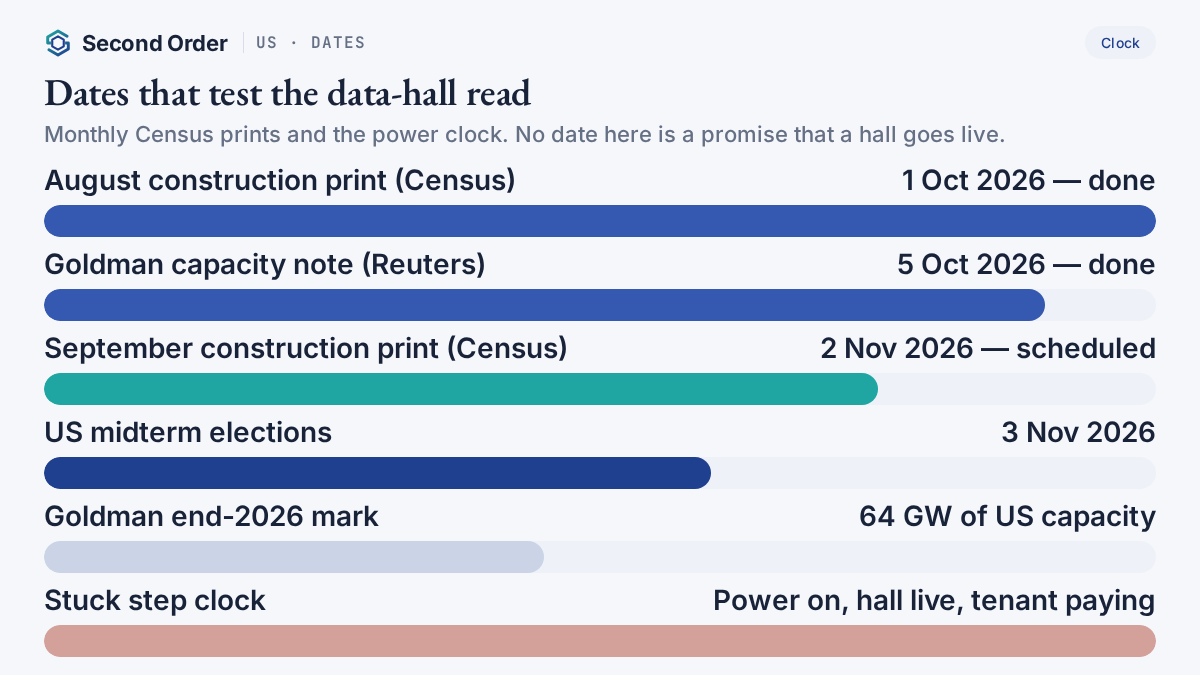
Dates to watch
US Census Bureau 1 Oct 2026 (next release date); Reuters 5 Oct 2026. Do not invent a date for a hall going live.
How is this different from …
- US CoreWeave Vera Rubin Pulse (1 Oct): That piece led on one company’s live capacity. It mentioned the GDP revision for building as a side note. This piece leads on the national building number for August.
- US chip is three cheques Pulse (4 Oct): That piece was about who gets paid for the chips. This piece is about the building, which Census counts without the chips.
- US FERC Joliet Pulse (25 Sep): One grid hookup. This piece is the national total of halls going up, and why power lags.
- Cash capex explainer (6 Oct): That page explains company cash spending. This piece reads a government count of work done on sites.
What would change this view?
The “halls rise, power waits” read weakens if:
- Private electric-power building starts growing as fast as data-hall building
- Census revises August’s $84.95 billion sharply lower on 2 Nov
- Data-hall building falls for two months in a row — a demand sign, not a power one
- Big owners report halls going live on time, with power, at scale
- Goldman or others raise, not cut, their 2027 capacity views
It stays intact while halls keep growing much faster than electric-power building, contractor backlogs stay long, and forecasters keep pushing later capacity back.
Practical takeaways
- US data-center building ran at an $84.95 billion yearly pace in August 2026, up 73.2% (Census, 1 Oct)
- Who gets paid: builders, trades and suppliers, as the work goes in — closer to cash than a plan
- The chips are not in the number; Census excludes racks and servers
- Money moved: chip and electronics factory building fell 45.2% to $52.3 billion
- Stuck step: power — electric-power building grew 10.8%, halls 73.2%
- Goldman: 64 GW by end-2026 (raised), 90 GW by end-2027 (cut 5 GW), per Reuters
- Watch the Census September print on 2 Nov and any August revision
FAQ
How much is the US spending to build data centers?
The US Census Bureau said on 1 Oct 2026 that private data-center construction ran at a seasonally adjusted yearly pace of $84.95 billion in August 2026. That is up 7.5% from July and 73.2% from August 2025. It is the highest reading since Census began the data-center line in 2014, by our check of the series.
Does the $85 billion include the AI chips?
No. Census counts work done on the building site: materials, labour, contractor profit, design and electrical work, including backup power. Its definitions exclude racks and servers in data centers, and land. The chips are a separate, later bill.
Who gets paid?
The builders, as the work is done. That means general contractors, electrical and mechanical trades, engineers and material suppliers. Contractors with data-center work reported 9.9 months of backlog in August, against 8.3 months for those without it (ABC survey, via ENR). This is a map of who gets paid, not a buy list.
What is the stuck step?
Power to switch the halls on. Private electric-power construction grew 10.8% in a year, to a $141.2 billion pace. Data halls grew 73.2%. A finished shell with no power earns nothing. Goldman Sachs cut its end-2027 US data-center capacity forecast by 5 GW to 90 GW (Reuters, 5 Oct 2026).
Is the rest of US construction booming too?
No. Total construction spending was 1.7% below a year earlier. By our arithmetic, private non-housing construction without data centers fell about 5.9% in a year. Building for computer, electronic and electrical factories fell 45.2%.
Is this investment advice?
No. Education only. It maps who gets paid and which step is stuck. It is not a recommendation to buy or sell any security.
Keep reading on the map
- US Markets hub — country door
- US chip is three cheques Pulse (4 Oct) — who is paid for the chips
- US Amazon leaseback Pulse (4 Oct) — talks are not closed
- US CoreWeave Vera Rubin Pulse (1 Oct) — poured is not energised
- US FERC Joliet Pulse (25 Sep) — one hookup, one queue
- Korea chip exports Pulse (5 Oct) — the chips that fill halls
- Hyperscalers, explained — primer
- Cash capex, explained — the cash that leaves first
- Hyperscalers stack — layer map
How we check this
Headline figures come from the US Census Bureau’s construction spending release of 1 Oct 2026 and its private detail tables. What the number includes and excludes comes from Census’s own definitions page. The capacity forecast is Goldman Sachs as reported by Reuters (5 Oct 2026). Contractor backlog and worker data are ABC and AGC-NCCER surveys as reported by ENR (1 Oct 2026). Building spend is not treated as profit, and a built hall is not treated as a live one. Where we work something out ourselves, the sum is shown and labelled our arithmetic.
Last reviewed: 6 Oct 2026 · Next review: after the Census September construction print (2 Nov 2026)
Spot an error? Tell us and we will correct it and note the change here.
Not investment advice. Do your own research.
Sources
- US Census Bureau — Monthly Construction Spending, August 2026 (1 Oct 2026): census.gov
- US Census Bureau — private construction detail, seasonally adjusted (1 Oct 2026): census.gov (xlsx)
- US Census Bureau — definitions of construction and value put in place: census.gov
- Reuters — Goldman sees US data center growth intact despite opposition (5 Oct 2026), via StreetInsider: streetinsider.com
- ENR — ABC and AGC-NCCER data on data-center construction (1 Oct 2026): enr.com