US Speed-to-Power: Why Power-Ready Halls Gate AI Infra
September 2026 in one line: US AI infra still waits on power-ready halls — transformer lead times above 160 weeks, ERCOT’s >438 GW large-load queue, and neocloud power that is contracted faster than it is energised.

US AI infrastructure is not short of chip headlines or lease announcements. The stuck step in September 2026 is still power-ready halls — energised megawatts at the rack — because transformers and post-approval buildout move slower than interconnect paper and GPU bookings.
US PULSE · Data as at 19 Sep 2026 · Next update: after ERCOT Batch Zero classification print / next CoreWeave power disclosure
Affects: Hyperscalers · Neoclouds · Semiconductors — Markets: US · Taiwan
Education only, not advice to buy or sell any security. Figures are from grid operators, company results and trade press dated as shown.
The numbers that matter this month
Substation transformer lead time (2026)
>160 weeks
WoodMac via DCK 12 May 2026
Stuck gearGSU transformer lead time (Q1 2026)
>160 weeks
vs ~143 weeks avg in 2024 · Reuters 9 Jul 2026
Stuck gearERCOT large-load requests
>438 GW
~89% data centres · Batch Zero · 18 Jun 2026
Queue scaleCoreWeave active power (Q2 2026)
1.5 GW
+~500 MW in the quarter · 11 Aug 2026
Live wattsCoreWeave contracted power
~3.7 GW
Same Q2 disclosure · gap ~2.2 GW (our math)
Not yet energisedPJM path to operation (2025 entrants)
>7 years avg
~3+ yrs to ISA · ~4 yrs after · DCK 12 May 2026
Post-queue waitSources: Data Center Knowledge 12 May 2026 (PJM + WoodMac lead times); Reuters 9 Jul 2026 (GSU / breakers); ERCOT news release 18 Jun 2026; CoreWeave Q2 results 11 Aug 2026. Status chips are Second Order’s read.
Contents: Why US? · Lead times · Queues · Our math · Where money sticks · Still stuck? · What’s next · Policy · What would change · FAQ
Why does the US matter for AI data center power?
It holds the broadest set of buyers and landlords chasing timed megawatts at once — hyperscalers, neoclouds, REITs and utilities — so power-ready delivery shows up first in US disclosures.
Plan + interconnect
Who: Developers / ISOs
Paid: Study fees, deposits, later network upgrades
Site electrical gear
Who: Transformer / switchgear makers
Paid: Long-lead orders, slot premiums, multi-year bookings
Power-ready hall
Who: Landlords / operators
Paid: Energised MW that can host racks
GPUs consume
Who: Hyperscalers / neoclouds
Paid: Cloud / GPU-hour revenue only after energisation
Chain is Second Order’s reading frame. Evergreen: speed-to-power explained · neocloud explained · data-centre REITs explained.
Layers on the map: Hyperscalers and Neoclouds. Related Markets: CoreWeave backlog → cash (complementary stuck step).
How long do transformers still take in 2026?
More than three years for the heavy gear that lights a hall — and the bottleneck has shifted past the queue into supply chain and post-approval buildout.
Equipment lead times (cited 2026)
Sources: Data Center Knowledge, 12 May 2026 (Boucher / WoodMac path incl. 140→150→>160 weeks substation); Reuters, 9 Jul 2026 (GSU >160 weeks by Q1 2026; breakers 125 vs 77).
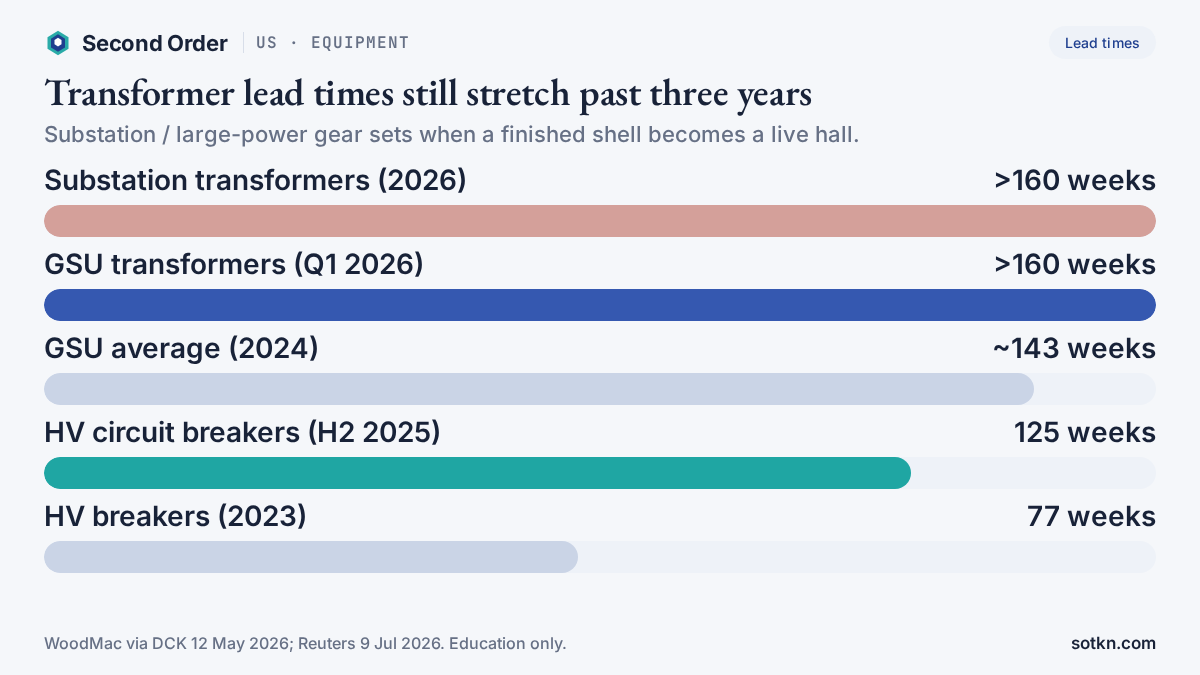
So-what: a campus can finish the shell and still wait on the electrical kit. Lease ink and live watts remain different facts — the same split the Explained piece named for interconnect versus transformers versus commissioning.
PJM data in the same May 2026 report put the average path for 2025 entrants above seven years to operation, with roughly three-plus years to an interconnection service agreement and about four years after approval. Milestone change requests (Jan 2026): permitting 29%, “other” 28%, supply chain 23%. Jeff Shields of PJM told DCK the issues outside the queue are now the biggest obstacle. Full five-step stack: speed-to-power explained.
What do ERCOT’s 438 GW and CoreWeave’s power gap show?
They show requested and contracted scale — not how many megawatts are already live.
Queue and power disclosures (mid-2026)
Sources: ERCOT news release + Trending Topics PDF, 18 Jun 2026; CoreWeave Q2 2026 results, 11 Aug 2026.
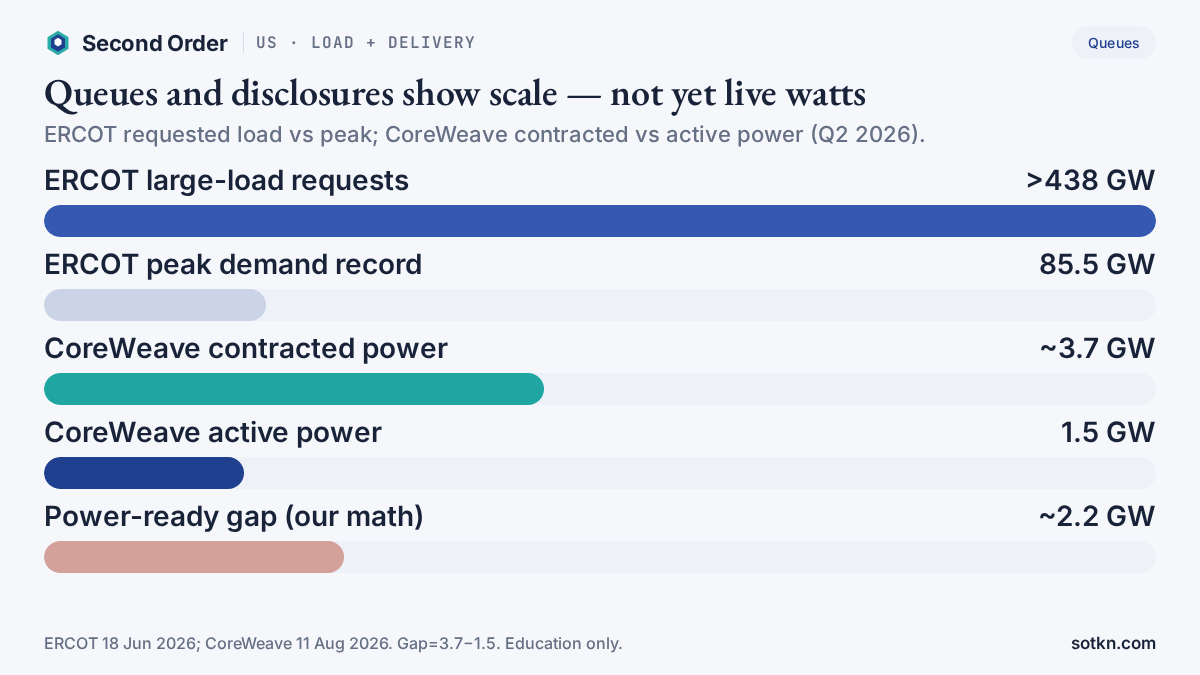
ERCOT’s Batch Zero process (PUCT-approved 18 Jun 2026) groups ≥75 MW loads into one systemwide study so the grid can allocate capacity and identify upgrades. That speeds intake and fairness — it does not invent transformers or compress Fall 2027 planning into this quarter’s energisations. Regulators themselves flag speculative “phantom” load inside large queues.
On the neocloud side, CoreWeave’s active-versus-contracted gap is the same conversion problem from another angle. Backlog becomes cash only as halls are power-ready and customers consume — mapped in CoreWeave and how neocloud contracts become cash.
Our power-ready gap math
Three short calculations — labelled ours — turn the disclosures into comparable units.
Our calculations (assumptions shown)
Inputs: CoreWeave 11 Aug 2026; ERCOT 18 Jun 2026 (queue + peak record); WoodMac >160-week lead via DCK / Reuters. Quarters use 13 weeks. Education only — not a build forecast.
What this tells you: even one large neocloud’s disclosure shows a multi-gigawatt wedge between contracted and active power, and transformer lead times alone can span more than three calendar years. What it does not tell you: how much of ERCOT’s 438 GW will ever energise, or which sites already hold transformer slots.
Wood Mackenzie also frames the equipment market: US data-centre capacity on a path from roughly 24 GW today toward 110 GW by 2030 (Reuters 9 Jul 2026), with the electrical-equipment market cited around $20 billion now toward $65 billion by 2030 (DCK 12 May 2026). Data centres’ share of that equipment market could reach ~40% in accelerated scenarios (Reuters). Scale raises demand for the same scarce gear — it does not clear the stuck step by itself.
Where does the money stick?
It sticks with whoever controls timed, delivered megawatts and the gear that creates them — not with the loudest megawatt announcement.
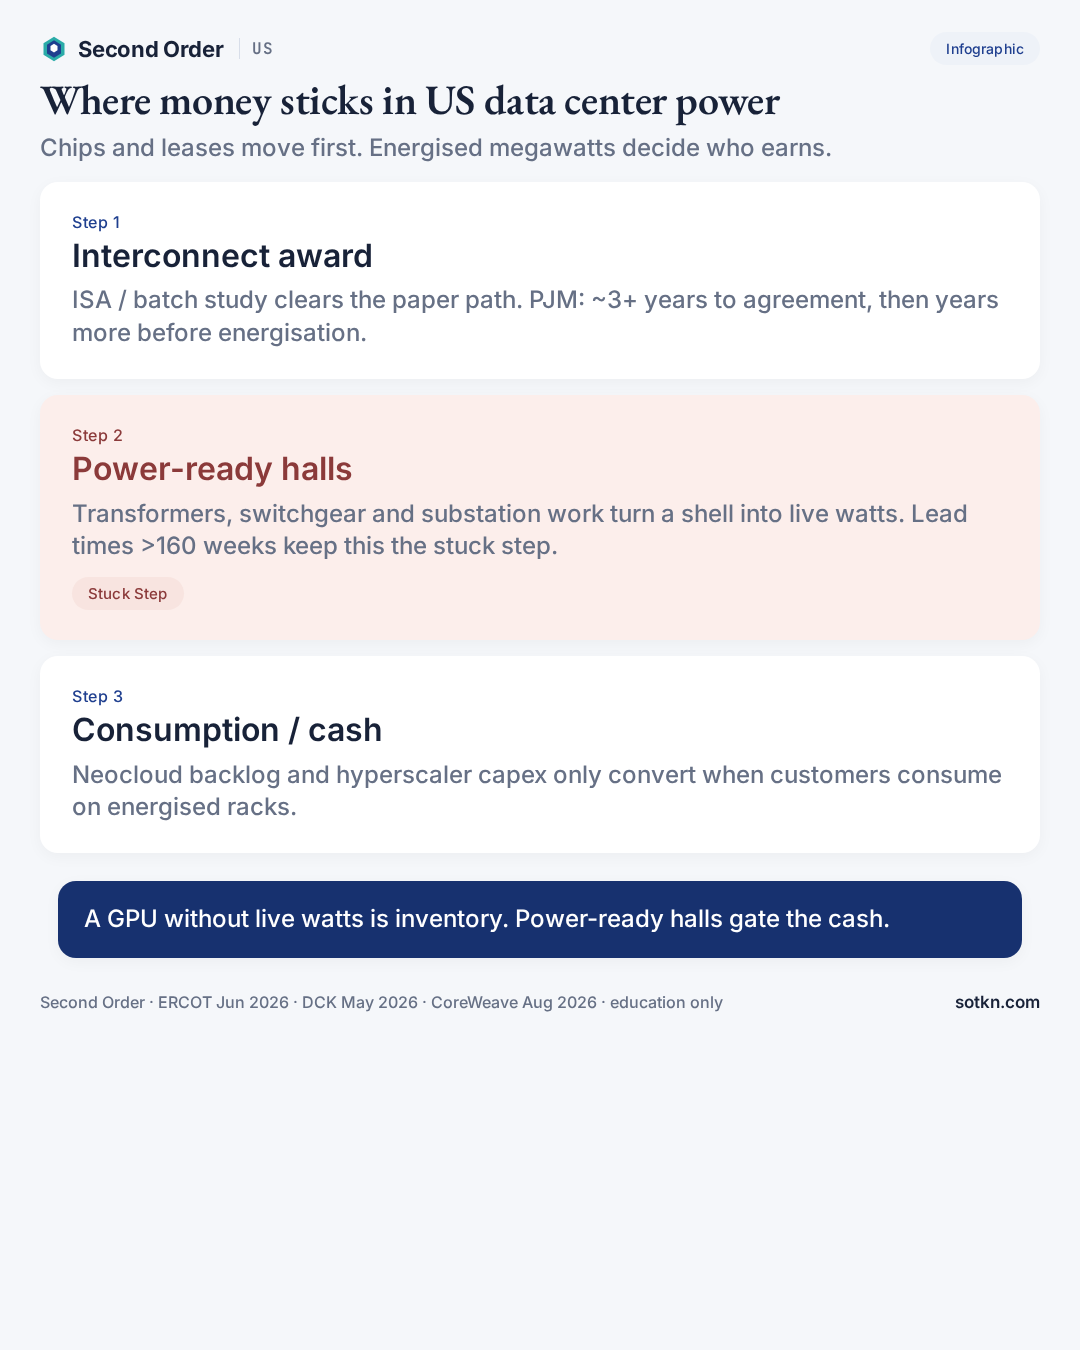
- Equipment makers and slot holders: Large power transformers and related switchgear stay scarce. Long-term agreements, advance payments and multi-geography sourcing (Reuters 9 Jul 2026) are how buyers compete for production slots — not for list prices alone.
- Landlords with energised capacity: Powered halls can host racks; empty shells cannot. See data-centre REITs explained.
- Operators who convert backlog: Neoclouds and hyperscalers earn when customers consume on live power. Interest and lease costs do not wait for the transformer.
One-line rule: scarce energised steps keep more of each dollar than announced megawatts.
Is speed-to-power still stuck?
Yes — the stuck step remains power-ready delivery after the queue, not “the grid” as one word.
Five clocks inside one “power” headline
Stack framing from speed-to-power explained. Cooling: liquid cooling Explained. On-site path: behind-the-meter power Explained.
Two cautions: (1) Queue reforms and Batch Zero improve study process — they are not a 2026 energisation guarantee. (2) Behind-the-meter generation can dodge some interconnect queues and still wait on turbines and the same electrical equipment WoodMac flags.
Paid depth on the long-dated queue argument: Analysis — speed-to-power and the 2028 grid queue.
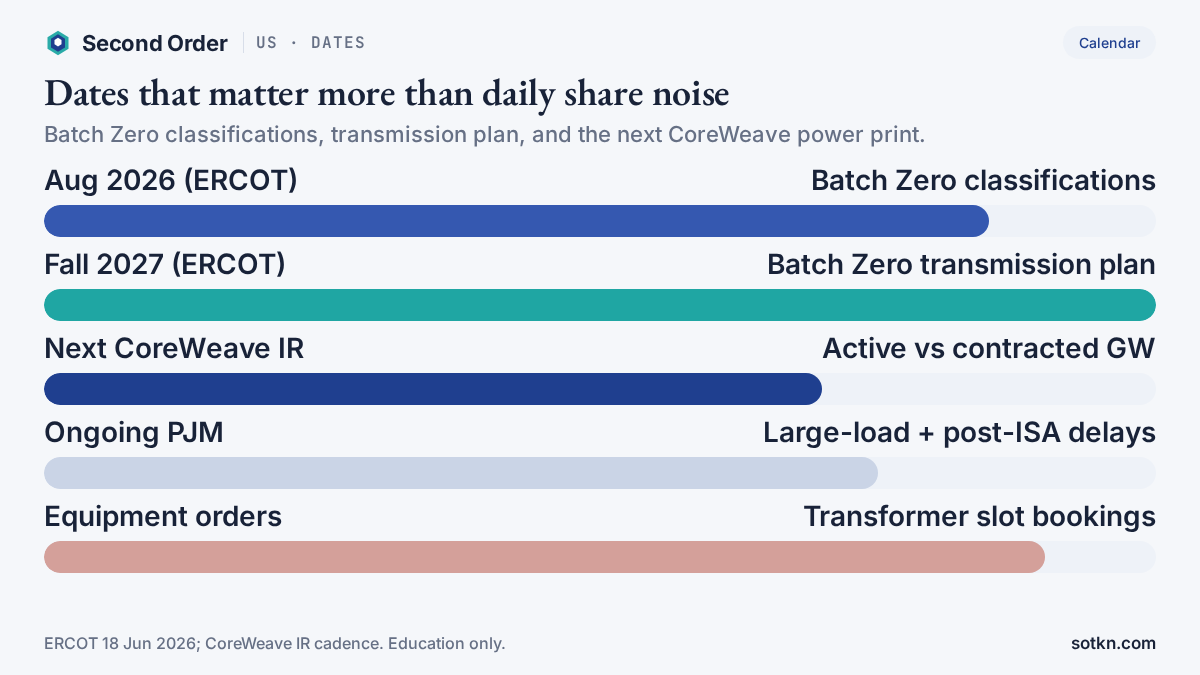
What dates and prints come next?
Four watches matter more than daily share noise.
Dates and signals to watch
How do grid rules frame this stuck step?
They change how loads are studied and when generation must travel with load — they do not erase multi-year equipment leads by themselves.
- ERCOT Batch Zero (PUCT 18 Jun 2026): systemwide batch study for ≥75 MW loads; first ISO to use this large-load batch approach, per ERCOT’s release.
- PJM cluster reforms: Cycle 1 agreements targeted in one to two years for new projects, while historical entrants still show multi-year post-approval waits (DCK 12 May 2026).
- Federal attention on fast-connecting large loads (Reuters notes mid-2026 regulator pressure on grid operators) raises the urgency of matching generation and curtailment rules to new load — RMI and others have warned that faster load connect without new supply only moves the scarcity.
So-what: policy can reorder the queue; transformers and substations still set the physical clock.
Who is exposed if you follow the money?
This is a map of exposure, not a recommendation to buy or sell.
- Neoclouds / GPU landlords: Watch energised MW and conversion language — CoreWeave is the live US Markets example for backlog versus power-ready delivery.
- Hyperscalers: Capex prints can outrun energised campuses; power and cooling clocks sit beside chip clocks.
- Electrical equipment & utilities: Lead times and multi-year orders are the tell. Domestic versus overseas bid mixes are shifting as buyers chase slots (Reuters 9 Jul 2026).
- Data-centre REITs / landlords: Powered versus empty capacity is the operating split — not headline leased MW alone.
Listed access paths vary by account and region. One example broker many readers already use is Interactive Brokers. Education only — we do not advise opening or funding any account.
What would change this view?
The “power-ready halls are the stuck step” read weakens if:
- WoodMac / utility surveys show substation and GSU lead times falling back toward ~1 year
- ERCOT publishes Batch Zero classifications with a clear, financed energisation path far below the raw 438 GW headline
- CoreWeave (and peers) report active power closing most of the contracted gap while backlog conversion accelerates
- PJM post-ISA delays shrink so that approval-to-energisation is no longer multi-year for AI-linked load
- Behind-the-meter generation plus on-site gear scales enough to bypass both queue and transformer scarcity at meaningful volume
- A non-power bottleneck (advanced packaging, HBM, or cooling) becomes the louder constraint in primary US disclosures
It stays intact while transformer leads stay above multi-year levels, large-load queues dwarf near-term energisations, and neocloud / landlord prints still separate contracted megawatts from live watts.
Practical takeaways
- Name the stuck step: power-ready halls (energised MW), not “power” as one slogan
- Treat >160-week transformer leads (May–Jul 2026 cites) as a physical clock beside any queue reform
- Read ERCOT’s >438 GW as requested load under Batch Zero — not as 2026 live capacity
- Pair this Pulse with the CoreWeave backlog piece: contracts and energisation are two halves of the same conversion
- Money sticks with timed gear and energised landlords; announcements without watts do not
FAQ
What is speed-to-power for AI data centres?
The clock from plan to live watts at the rack — generation or contracted supply, transmission, interconnect approval, site electrical gear, and final delivery into the hall.
Why are power-ready halls the stuck step in September 2026?
Because interconnect paper and lease announcements arrive faster than transformers, switchgear and energisation. Wood Mackenzie data cited in May–July 2026 put substation and GSU transformer lead times above 160 weeks.
How big is ERCOT’s large-load queue?
ERCOT said on 18 Jun 2026 it was tracking more than 438,000 MW of large-load requests, nearly 89% from data centres, under the new Batch Zero process for sites ≥75 MW.
How does this relate to CoreWeave’s backlog?
Complementary. The backlog Pulse maps contracts becoming cash; this Pulse maps why energised megawatts gate that conversion. CoreWeave disclosed 1.5 GW active vs ~3.7 GW contracted power in Q2 2026 (11 Aug 2026).
Is a queue megawatt the same as a live megawatt?
No. Requested or awarded interconnection is not energised capacity. Phantom load, withdrawals and post-approval delays mean queue size overstates near-term live watts.
Is this a buy list of power or AI stocks?
No. This Pulse maps who gets paid and where money sticks when power-ready halls are scarce. It is education, not a recommendation to buy or sell any security.
Keep reading on the map
- Speed-to-power explained · Behind-the-meter power explained
- US: CoreWeave backlog → cash · Neocloud explained
- Data-centre REITs explained · Liquid cooling explained
- US Markets · Analysis: speed-to-power / grid queue · Taiwan Pulse
How we check this
Figures come from company filings and government releases, each dated in the list below. Capacity and timing from press reports are labelled as reported, not guided. Where we work something out ourselves, the arithmetic is shown in full.
Last reviewed: 20 Sep 2026 · Next review: after next ERCOT / PJM queue or major neocloud power disclosure
Spot an error? Tell us and we will correct it and note the change here.