10.2 TWh, +37.9%: Who Gets Paid When China Data-Services Power Outruns the Mix
September 2026 in one line: NEA’s August print puts internet data-services electricity at 10.2 TWh, +37.9% YoY, while national use rose 1.7%. Who gets paid is new-format load. The stuck step is still matching compute to energisable power.

China’s August electricity print is not a story about a tight national grid in the aggregate. National use rose 1.7%. Internet data services used 10.2 TWh, up 37.9%. Charging and battery-swap used 17.2 TWh, up 51.2%. Who gets paid is whoever is already selling kilowatt-hours into those new-format loads — and whoever can energise a hall against a record peak of 1,560 GW. The stuck step is still matching compute build to energisable power: the meter is running; the connectable megawatt is not automatic.
CHINA PULSE · Data as at 28 Sep 2026 · Next update: after the next NEA monthly electricity print
Affects: Hyperscalers · The Stack — Markets: China · US · Korea
Education only, not advice to buy or sell any security. Electricity figures are from NEA via Xinhua, dated as shown. Bid coverage and the 27 Sep Reuters/The Information item are labelled as trade press or unverified reporting.
The numbers that matter this month
Internet data-services electricity (Aug 2026)
10.2 TWh · +37.9% YoY
NEA via Xinhua 20 Sep · NEA site 24 Sep 2026
Fresh printNational electricity (Aug 2026)
1,033.2 TWh · +1.7% YoY
Again above 1 trillion kWh · residents −4% on weather
The mixPeak load (Aug 2026)
1,560 GW
+49.69 GW vs prior-year max · 7 days above that max
RecordCharging & battery-swap (Aug 2026)
17.2 TWh · +51.2% YoY
The other new-format engine in the tertiary print
Cash stepJan–Aug internet data services
69.5 TWh · +42.5% YoY
Checks against July 9.9 + August 10.2 on the prior cumulative
CumulativeMatching compute to energisable power
Stuck step
The monthly meter is loud. Connectable MW at a record peak is still the gate.
Stuck stepSources: NEA 24 Sep 2026; Xinhua English 20 Sep 2026. Status chips are Second Order’s read.
On this page: Why China? · What changed · Our math · Where money sticks · Is matching still stuck? · Dates · vs Power–Compute / HBM · What would change · FAQ
Why does China matter now?
Because the country that is trying to build a parallel AI stack is now printing a monthly electricity mix in which data halls grow more than twenty times faster than the system — while the system’s peak load is already at a record. That combination is the China version of speed-to-power: not “is there enough generation in the yearbook,” but whether a hall can take energisable megawatts when the meter wants them.
New-format electricity
Who: Internet data services · charging / swap
Paid: 10.2 TWh and 17.2 TWh in August — the cash step on the meter
High-tech manufacturing load
Who: Computers, autos, electrical machinery, special equipment
Paid: 122.2 TWh in August, +7.2% — industrial kWh still rising as residents fell
Grid peak + energisable path
Who: Grid / planning / green direct-connect / 源网荷储
Paid: Only if a hall can connect at a 1,560 GW peak system
Accelerators inside the hall
Who: Domestic GPU names · HBM path
Paid: Separate binds — see HBM Access; this week’s Biren bid is a supply footnote, not this Pulse’s lead
Evergreen: speed-to-power explained. Siblings: Power–Computing · HBM Access. If you only remember one thing: the mix is the bind. A 1.7% national print can hide a 38% data-hall print.
What changed — NEA’s August meter, not another plan slide
The dated print is the National Energy Administration’s August 2026 electricity data. Xinhua reported it on 20 September; NEA posted the same figures on 24 September. That is the trigger for this Pulse. The 22 September Power–Computing Pulse still had to use the July NEA line (9.9 TWh of internet data services, +40.1% YoY, published 21 August). August is the first full monthly meter after the 11 September State Council computing-network meeting.
What the August table actually says, in order:
National electricity use was 10,332 亿 kWh, or 1,033.2 TWh, up 1.7% year on year — the second month the headline has cleared a trillion kilowatt-hours. Peak load hit a record 15.6 亿 kW (1,560 GW), 49.69 GW above the prior-year maximum, and ran above that old max on seven days. First industry +2.7% to 16.9 TWh. Second industry +2.4% to 612.4 TWh, of which industrial use +2.7%. High-tech and equipment manufacturing 122.2 TWh, +7.2%. Tertiary +5.1% to 215.5 TWh. Inside that, charging and battery-swap 17.2 TWh, +51.2%, and internet data services 10.2 TWh, +37.9%. Residential use fell 4% to 188.3 TWh; NEA/Xinhua attribute that to more typhoons and heavy rain than a year earlier, which cut air-conditioning.
January–August national use was 71,730 亿 kWh (7,173 TWh), +4.3%. High-tech and equipment manufacturing 845.1 TWh, +9.3%. Charging/swap 114.7 TWh, +55.1%. Internet data services 69.5 TWh, +42.5%.
CEC’s Wu Liqiang, quoted in the same print, called secondary and tertiary industry the “main engines,” and “new business formats” an important incremental source for the tertiary line. That is the official mix language. We take it as a description of the table, not as a forecast.
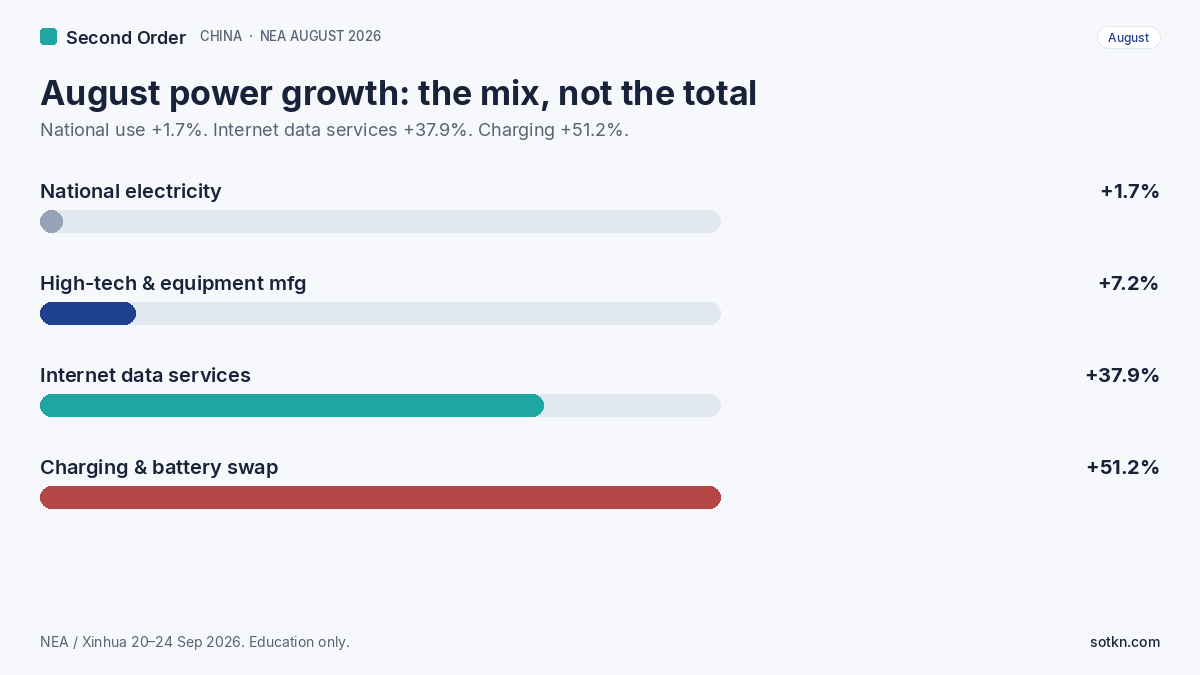
August power growth is a mix story. Sources: NEA / Xinhua 20–24 Sep 2026. Education only.
Two cautions. First, internet data services is a NEA sector line, not the same object as the NEA-path “computing electricity” ~170 TWh / ~800 TWh band used on 22 September. It is the monthly meter we can date. Second, a weather-driven residential drop pulls the national +1.7% down. The new-format lines are louder relative to the system than the headline implies — and the peak-load record is the grid-stress print the annual TWh growth rate conceals.
Same-week footnote, not the lead: 24 September trade coverage said Biren won Kunlun Lingyi phase-one package one at ¥1.74bn, 45-day delivery, while package two (~¥4.52bn of ~¥6.26bn) was voided for too few bidders. Reported bid coverage, not an NEA figure — a reminder that a loud meter still needs cards that can ship.
Our math — labelled our arithmetic
Second Order calculation from the dated NEA figures. This is our arithmetic, not NEA guidance and not a forecast of what September will print.
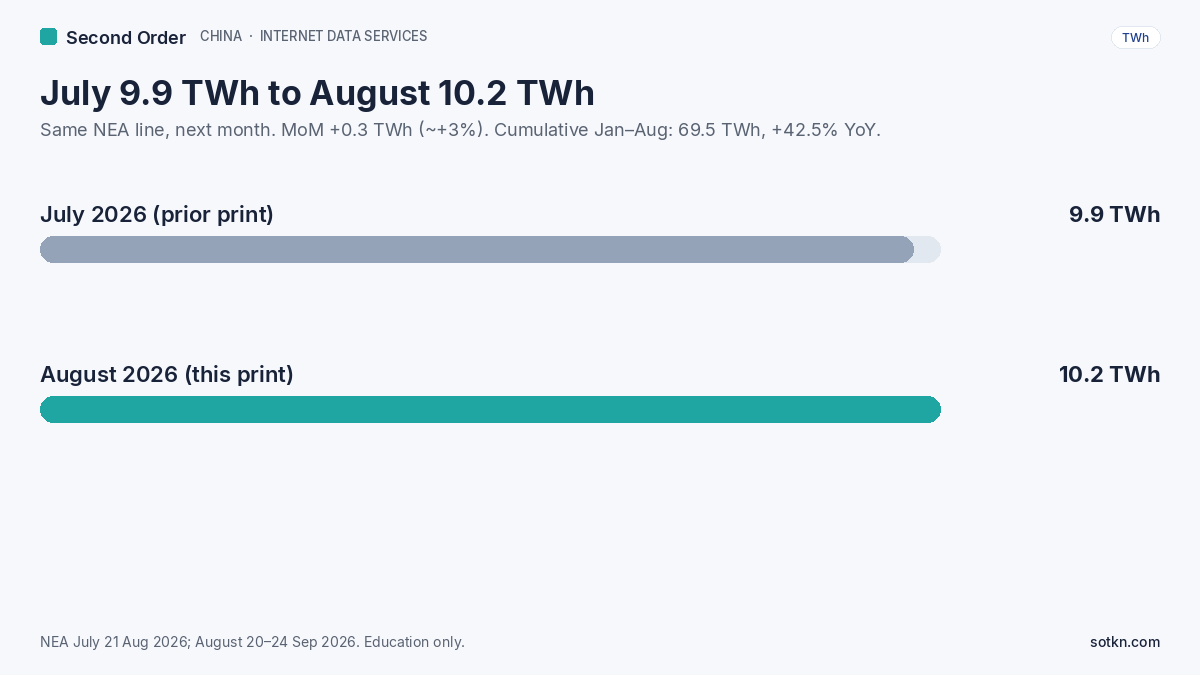
Same NEA line, next month. Sources: NEA July 21 Aug 2026; August 20–24 Sep 2026. Education only.
Check the cumulative. The 22 September Pulse used January–July internet data services at 59.3 TWh. 59.3 + 10.2 = 69.5 TWh, which is exactly the January–August figure in this print. The months add. We are not mixing series.
Share of the system. August data-services 10.2 ÷ national 1,033.2 = 0.987%, which we round to 0.99%. January–August 69.5 ÷ 7,173 = 0.969%, which we round to 0.97%. Data halls are still about one percent of China’s kilowatt-hours. They are not a rounding error in the growth column.
Growth multiple. 37.9 ÷ 1.7 ≈ 22.3×, which we label 22×. Internet data services grew more than twenty times as fast as the system in August. Charging/swap at +51.2% is faster still; we keep it as the twin new-format engine, not as AI compute.
Month-on-month. 10.2 − 9.9 = +0.3 TWh, or about +3.0% from July to August. YoY cooled from +40.1% in July to +37.9% in August. Cooling is not a collapse. The line is still running in the high-thirties.
Implied 2025 and the increment. August 2025 implied level: 10.2 ÷ 1.379 ≈ 7.40 TWh. January–August 2025 implied: 69.5 ÷ 1.425 ≈ 48.8 TWh. Eight-month increment: 69.5 − 48.8 = +20.7 TWh. If that pace held for a full year: 20.7 × (12 ÷ 8) ≈ 31 TWh/yr of additional internet data-services electricity.
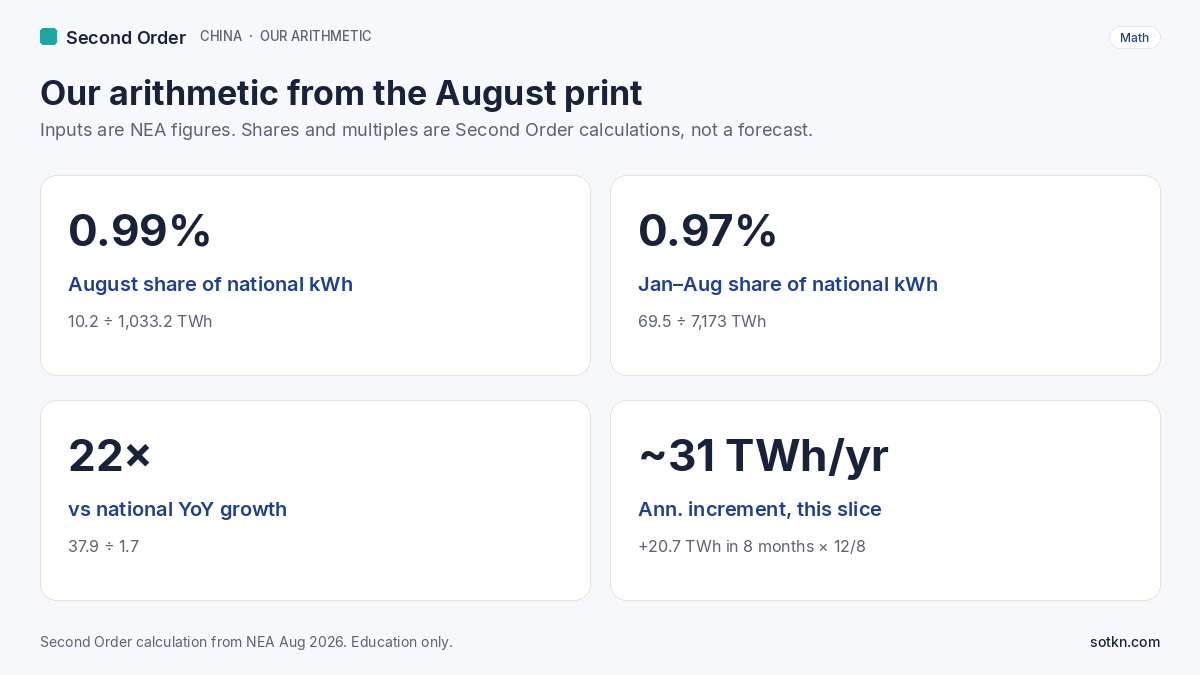
Our arithmetic from dated NEA figures. Not a forecast. Education only.
What this tells you. A 31 TWh/yr increment on the data-services meter is a large provincial-scale add. It is not the NEA-path “+>100 TWh/yr” computing-facility phrase from 22 September. Do not force 31 against 100 into a fake miss. The dated slice is still compounding near 40% while the system crawls, and peak load — 1,560 GW, seven days above last year’s max — is already the stress variable.
What it does not tell you. Which hub, which direct-connect project, or which listed name clears the gate. Price is a different question. We do not do price calls. July’s share was ~0.95% of 1,040 TWh; August’s 0.99% is a small step-up. Share is creeping. Growth rate is the tell.
Where does the money stick?
At the step that turns a loud monthly meter into utilised, connectable load.
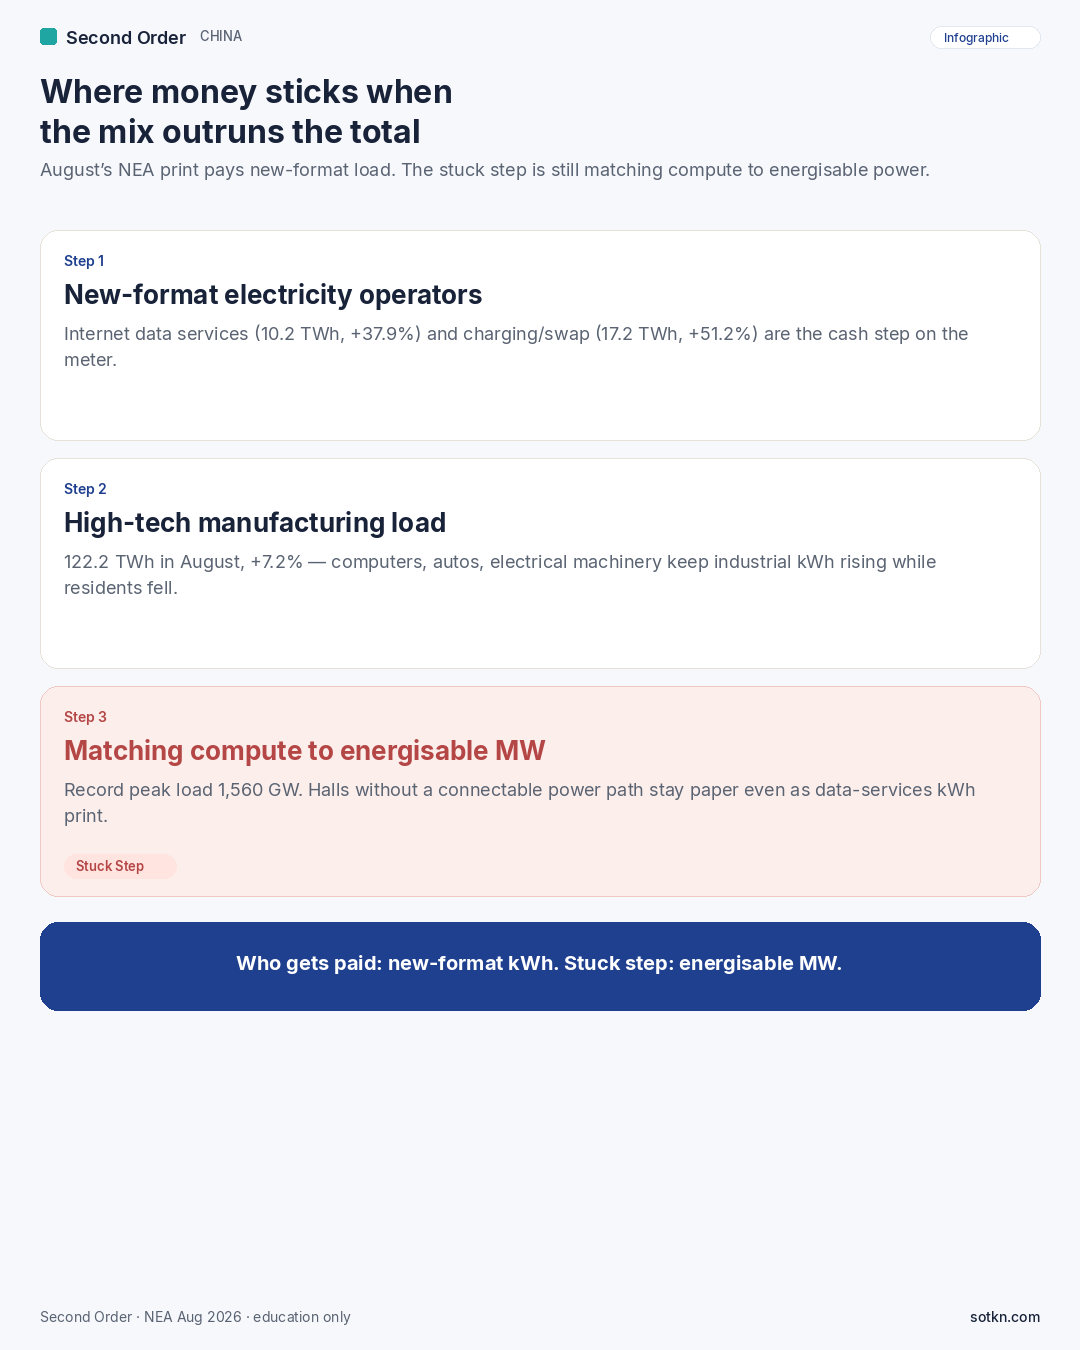
Where money sticks under the August mix. Sources: NEA Aug 2026. Education only.
-
New-format electricity operators. Internet data services (10.2 TWh, +37.9%) and charging/swap (17.2 TWh, +51.2%) are the lines that actually grew like AI-era loads. Whoever is already billing those kilowatt-hours gets paid on the meter this month — cloud and hall operators on the first line, charging networks on the second. Do not collapse them into one AI trade.
-
High-tech manufacturing load. 122.2 TWh in August, +7.2%, with computers and communications +7.5%, automobiles +7.6% (NEV production electricity +22.2% in the Xinhua breakdown), special equipment +8.2%, electrical machinery +12.3%. That is the industrial cash step while residential kWh fell. It is not the stuck step. Many factories can take power the grid already built for them.
-
Not “whoever announced another hall.” The 11 September instruction still stands: green-power direct connection, source-grid-load-storage, joint planning. Paper racks at a 1,560 GW peak, without a connectable path, are the failure mode. Follow who gets paid for connected power.
One-line rule: when the mix outruns the total, money sticks with new-format kWh and with whoever can energise at peak.
Is matching compute to energisable power still stuck?
Yes. August is evidence the demand clock is still running, not evidence the connection clock has cleared. The 22 September Pulse named the stuck step after a cabinet meeting. This Pulse names the same step after a monthly statistic. Data-services electricity is still growing in the high-thirties. Peak load is a record. Direct-connection and 源网荷储 projects still have to land.
What the August meter settles — and what it does not
US contrast: the Joliet $1-credit Pulse maps interconnection paper. China’s August print is the meter twin: halls need a path that can energise when peak load is already a record. Same family of stuck step (energisable MW); FERC docket versus NEA monthly plus 算电协同.
What dates matter
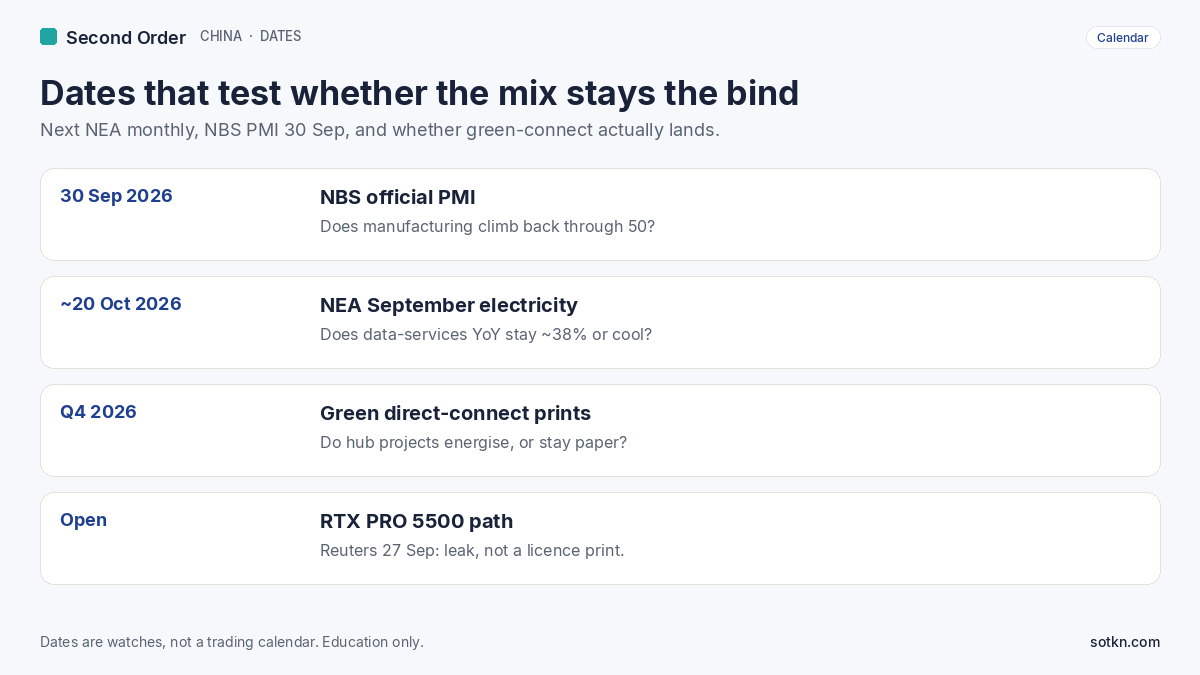
Dates to watch for the China mix read. Education only.
- 30 Sep 2026 — NBS official PMI. August manufacturing was 49.8. Context for industrial kWh, not a substitute for NEA sector lines.
- Around 20 Oct 2026 — NEA September electricity. Does data-services stay in the mid-to-high thirties? Does peak load set another record after cooling season?
- Q4 2026 — green direct-connect / 源网荷储 landing prints. Dated hub utilisation is what would start to unstick the step.
- Open — RTX PRO 5500 path. Reuters on 27 September, citing The Information, said MIIT had asked some firms including ByteDance and Alibaba about Nvidia RTX PRO 5500 purchase plans. Reuters could not verify it. Treat as unverified leak, not a licence print. More usable cards can raise hall load; they do not clear the power bind.
How is this different from the Power–Computing Pulse — and from HBM Access?
As a meter update, not a rewrite.
Power–Computing owns the cabinet instruction and the +>100 TWh/yr path. This Pulse owns the August statistic. Same stuck step. New evidence: 10.2 TWh, +37.9%, record peak.
HBM Access still owns advanced HBM inside the card. Board quotes do not move because a hall used 10.2 TWh. Memory shows up in ASPs. Power shows up in the NEA sector line and at peak.
Biren bid coverage is a footnote: even a ~¥6.26bn hall budget can fail to award most of itself if too few qualified GPU suppliers show up. Different clock from power.
- Cloud / state buyers: usable clusters need memory, cards, and energisable MW.
- Power / DC developers: paid when packages clear; stranded if halls stay paper at a record peak.
- Domestic accelerator / memory names: still on the HBM Access map.
Listed access paths vary. One example broker many readers already use is Interactive Brokers. Education only — we do not advise opening or funding any account.
What would change this view?
The “mix is the bind / matching still stuck” read weakens if:
- NEA’s next monthly data-services line cools into the low teens or below while national use re-accelerates — a mix normalisation
- A string of dated green-power direct-connection / 源网荷储 energise prints shows hubs clearing the gate at scale
- Peak load stops setting records and hall utilisation prints rise — a sign connectable MW is catching the meter
- Official revisions walk back the NEA-path ~6% / ~800 TWh computing-electricity band used on 22 September
- Evidence that eastern latency halls can expand without co-planned power (policy softens)
- Power stops being scarce relative to memory — then re-weight toward the HBM Access stuck step
- A non-power bottleneck (tools, cooling, fibre, or bid-scale domestic GPUs) becomes the louder primary constraint
The view stays intact while data-services YoY stays in a high-thirties band, peak load stays at or near records, and project-level energise remains the conversion problem.
Practical takeaways
- Name the stuck step: matching compute build to energisable power — the August mix, not the 1.7% national headline
- NEA 20–24 Sep 2026 is the dated print: internet data services 10.2 TWh, +37.9%; charging/swap 17.2 TWh, +51.2%; peak 1,560 GW
- Our arithmetic: ~1% of kWh, ~22× system growth, ~+3% month-on-month, ~31 TWh/yr increment on this slice if the eight-month pace held — not the +100 TWh/yr computing path
- Who gets paid: new-format kWh and grid/planning paths that can energise at peak
- Keep Power–Computing as the policy sibling and HBM Access as the memory bind; do not rehash Ascend/CXMT as this Pulse’s lead
- Next hard data: NEA September electricity, likely around 20 October
FAQ
What did China’s NEA print for August 2026 electricity?
National use was 1,033.2 TWh, +1.7% year on year. Internet data services used 10.2 TWh, +37.9%. Charging and battery-swap used 17.2 TWh, +51.2%. Peak load hit a record 1,560 GW. Xinhua reported the figures on 20 September 2026; NEA posted them on 24 September.
Who gets paid when data-services power outruns the national mix?
Operators already selling kilowatt-hours into internet data services and charging/swap, plus high-tech manufacturing load that kept industrial kWh rising while residential use fell. Grid, planning, and green direct-connect paths get paid only if they can energise halls at a record peak. Announced halls without a connectable path stay paper.
Is matching compute to energisable power still stuck?
Yes. August shows the demand clock still running. It does not show that green-power direct connection and source-grid-load-storage have landed at hub scale. Record peak load is the stress print.
How is internet data-services electricity different from the +100 TWh/yr computing path?
They are different objects. “Internet data services” is a monthly NEA sector line (10.2 TWh in August; 69.5 TWh in January–August). The +>100 TWh/yr toward ~800 TWh by 2030 is a broader computing-facility path as reported on the 15th Five-Year energy plan. Our ~31 TWh/yr increment is our arithmetic on the sector line only.
How is this Pulse different from China Power–Computing and China HBM Access?
Power–Computing (22 Sep) maps the State Council 算电协同 instruction. This Pulse maps the August NEA meter. HBM Access (19 Sep) maps advanced memory inside the domestic card. Same country, three layers.
Is this a buy list of China grid or data-centre stocks?
No. This Pulse maps who gets paid and which step is stuck. It is education only, not a recommendation to buy or sell any security.
Keep reading on the map
- Speed-to-power explained · Hyperscaler explained · HBM explained
- China Power–Computing Pulse · China HBM Access Pulse · US Joliet $1-credit Pulse · China Markets hub
- Hyperscalers stack · The Stack · Analysis · Wire
How we check this
Figures come from government releases, each dated in the list below. Bid coverage and unverified reporting are labelled as such. Where we work something out ourselves, the arithmetic is shown in full and marked “our arithmetic.”
Last reviewed: 28 Sep 2026 · Next review: after the next NEA monthly electricity print
Spot an error? Tell us and we will correct it and note the change here.
Sources
- 国家能源局 — 8月份全社会用电量再破万亿千瓦时 (24 Sep 2026)
- Xinhua — China’s power use surge spotlights industrial upgrading, emerging-sector momentum (20 Sep 2026)
- 国家能源局 — 2026年1–7月全社会用电量 (21 Aug 2026; July data-services 9.9 TWh / Jan–Jul 59.3 TWh)
- Second Order — China Power–Computing Pulse (sibling · policy bind)
- Second Order — China HBM Access Pulse (sibling · memory bind)
- 快科技 — 昆仑领奕智算中心包一壁仞中标 1.74亿元 / 包二废标 (24 Sep 2026; trade coverage of a bid, not an NEA figure)
- Reuters — China weighs allowing ByteDance, Alibaba to buy new Nvidia chips, The Information reports (27 Sep 2026; unverified)
Education only. Not investment advice. Do your own research. Second Order may correct figures if primary sources revise them — next planned refresh after the next dated NEA monthly electricity print.