62% of the Jump: Who Gets Paid When China Electronics Prints Cash
October 2026 in one line: NBS’s Jan–Aug print puts electronics at ¥847.5bn of profit, up 1.1 times, carrying 62% of all industrial profit growth. Who gets paid is that electronics P&L. The stuck step is still advanced HBM.

China’s industrial profit print is not a story about a tight auto market. Autos lost money. Electronics printed ¥847.5 billion, up 1.1 times, and carried 62% of the entire industrial profit jump. Who gets paid is that electronics P&L — optoelectronics, discrete chips, materials, circuits, computer wholes. The stuck step is still the scarce one this table does not own: advanced HBM inside the domestic card.
CHINA PULSE · Data as at 2 Oct 2026 · Next update: after NBS January–September industrial profits
Affects: Semiconductors · The Stack — Markets: China · Korea · Taiwan
In short: On 28 September 2026 the National Bureau of Statistics printed January–August industrial profits of ¥5,271.98 billion, up 15.7%. Computers, communications and other electronic equipment made ¥847.47 billion of that, up 109.9%. Chief statistician Yu Weining said electronics contributed 62.0% of all industrial profit growth, with chip demand from new-energy vehicles, IoT and computing centres lifting optoelectronic-device profits 72% and semiconductor-discrete-device profits 51.8%. Who gets paid: the electronics line and the high-tech manufacturing P&L (+54.7%). The stuck step is still advanced HBM access — this table names discrete and opto, not stacked memory. Power stays on the Data-Services Pulse. This is a map of who gets paid — not a buy list.
Education only, not advice to buy or sell any security. Figures are from NBS and official English reprints dated as shown.
The numbers that matter this month
| Figure | Read | |
|---|---|---|
| Dated trigger | NBS, 28 Sep 2026 | Jan–Aug industrial profits; electronics is the engine |
| Industrial profits (Jan–Aug) | ¥5,271.98bn · +15.7% YoY | NBS Table 1 |
| Electronics profits | ¥847.47bn · +109.9% | Computers, comms and other electronic equipment |
| Electronics contribution | 62.0% of the industrial profit jump | Yu Weining, same-day interpretation |
| High-tech manufacturing profits | +54.7% YoY | 39 percentage points above all industry |
| Optoelectronic devices | +72.0% | Named against chip demand from NEVs, IoT, computing centres |
| Semiconductor discrete devices | +51.8% | Same NBS note — not leading-edge logic, not HBM |
| Electronic special materials / circuits | +2.3× / +49.1% | The copyable bill-of-materials steps |
| Automobile manufacturing profits | ¥253.38bn · −16.0% | The contrast: volume without the scarce step |
| Same-week twin | NBS PMI, 30 Sep 2026 | Manufacturing 50.1; high-tech 52.5 |
Status chips are Second Order’s read. Full sources are at the end of this article.
Why does China matter now?
Because the country that is trying to build a parallel AI stack just printed a P&L in which one electronics line did three-fifths of all industrial profit growth — while the steps that actually bind AI chips (advanced memory, leading-edge wafers, energisable halls) sit on other doors.
Taiwan still makes most of the leading logic and does much of the CoWoS packaging. Korea still allocates HBM. China’s industrial-profit table is the cash print around those doors: optoelectronics, discrete devices, materials, circuits, computer wholes, fibre. That is who gets paid this month. It is not who owns the stuck step.
If you only remember one thing: a 110% electronics profit print is not a leading-edge foundry. Cash can compound at the copyable steps while HBM and power stay booked.
New to the China map? HBM Access · Power–Computing · Data-Services meter.
What changed
The dated print is the National Bureau of Statistics’ January–August 2026 industrial-profits release, posted 28 September 2026 at 09:30 Beijing time. Yu Weining’s same-day interpretation is the official so-what. Xinhua English carried the same figures that morning.
What the tables actually say, in order:
Scale-above industrial firms made ¥5,271.98 billion of profit, up 15.7% on a comparable basis. Revenue was ¥93.09 trillion, up 6.6%. The operating-profit margin was 5.66%, up 0.44 percentage points. August alone slowed to +4.2% on a high year-earlier base; Yu flagged that the gross-profit line (revenue minus cost) still accelerated, up 7.5% in August.
Manufacturing profits were ¥3,969.53 billion, up 17.4%. Mining was +35.1%. Electricity, heat, gas and water was −12.0%. Power and heat production and supply, the grid-adjacent line, was ¥446.25 billion, −15.1%. Electrical machinery was ¥367.19 billion, −5.2%. Automobiles were ¥253.38 billion, −16.0%, on revenue of ¥7,006.16 billion that only rose 2.9% while costs rose 4.0%.
The electronics line is a different object. Computers, communications and other electronic equipment printed revenue ¥12,810.29 billion, +20.1%, costs ¥10,842.29 billion, +16.7%, and profit ¥847.47 billion, +109.9%. That is the cash step.
Yu named the mix inside it. Chip demand from new-energy vehicles, the Internet of Things and computing centres lifted optoelectronic-device profits 72.0% and semiconductor-discrete-device profits 51.8%. Electronic special materials rose 2.3 times; electronic circuits 49.1%. High-tech manufacturing profits rose 54.7% — 39 percentage points faster than all industry. Under computing-infrastructure build: fibre-optic manufacturing +5.3 times, optical-cable +1.0 times. Computer wholes +3.9 times, computer peripherals +2.6 times, industrial-control computers +1.3 times, communications-system equipment +48.7%.
Two-day twin, not the trigger: on 30 September NBS printed official PMI. Manufacturing 50.1, up 0.3 points, back through 50. Production 51.7. New orders 50.5. Xinhua via People’s Daily on 1 October put equipment-manufacturing PMI at 51, high-tech manufacturing at 52.5, consumer goods at 50.7. That is a climate print. It does not replace the 28 September P&L.
What did not change on 28 September is the HBM door or the power door. The 19 September HBM Access Pulse still owns stacked memory inside the domestic card. The 28 September Data-Services Pulse still owns the meter: 10.2 TWh of internet data-services electricity, +37.9%, against a 1,560 GW peak. A profit table does not energise a hall and does not allocate HBM.
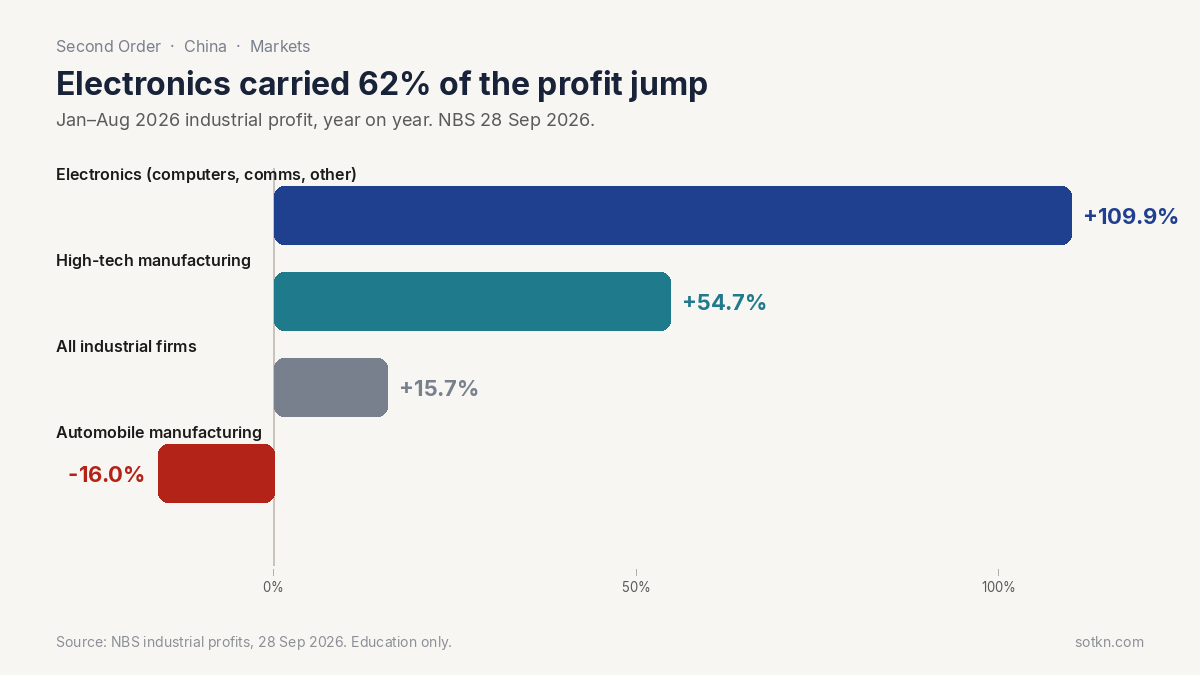
Electronics carried the profit jump. Autos did not. Source: NBS 28 Sep 2026. Education only.
Our math
Four calculations — labelled our arithmetic — put the dated print on one unit. This is not NBS guidance and not a forecast of what January–September will print.
1. Check Yu’s 62% contribution.
Electronics 2026 profit ¥847.47 billion, up 109.9%. Up 109.9% means 2026 = 2025 × 2.099.
847.47 ÷ 2.099 = ¥403.75 billion implied 2025 electronics profit.
Increment: 847.47 − 403.75 = ¥443.72 billion.
All-industry 2026 profit ¥5,271.98 billion, up 15.7%. Implied 2025: 5,271.98 ÷ 1.157 = ¥4,556.59 billion.
Increment: 5,271.98 − 4,556.59 = ¥715.39 billion.
443.72 ÷ 715.39 = 62.03%, which we round to 62.0%. Yu’s contribution rate checks. We are not mixing series.
2. Stock versus flow.
Electronics share of this year’s profit stock: 847.47 ÷ 5,271.98 = 16.08%, which we round to 16.1%.
Electronics is about one-sixth of industrial profit and three-fifths of the increment. That is the tell. The growth column is louder than the stock column — the same pattern as data-services kilowatt-hours on 28 September, on a different object.
3. Profit versus sales inside electronics.
Electronics revenue +20.1%. Electronics profit +109.9%.
109.9 ÷ 20.1 = 5.47 times, which we label 5.5×. Profit grew five-and-a-half times as fast as sales. That is mix and price, not just more boxes. NBS’s own cost line agrees: electronics costs +16.7% against revenue +20.1%. Operating profit on this line: 847.47 ÷ 12,810.29 = 6.62%, against 5.66% for all industry and 253.38 ÷ 7,006.16 = 3.62% for automobiles.
4. Electronics increment versus the auto loss.
Autos 2026 profit ¥253.38 billion, down 16.0%. Implied 2025: 253.38 ÷ 0.84 = ¥301.64 billion. Lost: ¥48.26 billion.
Electronics increment ÷ auto loss: 443.72 ÷ 48.26 = 9.19 times, which we label 9.2×. The electronics line gained about nine times what the auto line lost. Do not read that as “EVs funded chips.” Yu tied some of the chip demand to new-energy vehicles, IoT and computing centres. The auto manufacturing P&L still fell. Those are different rows.

Our arithmetic from NBS Table 3, 28 Sep 2026. Not a forecast. Education only.
What this tells you. Cash is printing at electronics and at the high-tech manufacturing wrap. The official mix inside that cash is optoelectronics, discrete semiconductors, materials, circuits, computer wholes and fibre — the steps a parallel stack can already bill.
What it does not tell you. Which listed name, which node, or whether advanced HBM got easier. Price is a different question. We do not do price calls. We also do not staple SMIC’s foundry mix onto this NBS electronics line. They are different objects.
Where does the money stick?
At the steps this P&L can already bill — and, for the scarce steps, still not here.

Where money sticks under the 28 Sep industrial-profit print. Sources: NBS. Education only.
1. Electronics makers — who gets paid now. Computers, communications and other electronic equipment is the cash step: ¥847.47 billion of profit, +109.9%, 62% of the industrial jump. Inside Yu’s note, optoelectronic devices, discrete semiconductors, electronic special materials, electronic circuits, computer wholes, peripherals, industrial-control computers, communications-system equipment, fibre and cable are the named sub-steps. Those firms get paid on this print. High-tech manufacturing as a wrap (+54.7%) is the same family.
2. Advanced HBM — the stuck step this table does not own. Yu named discrete devices and optoelectronics against chip demand from computing centres. He did not name stacked high-bandwidth memory. HBM still sits on the Korea door for the global stack and on the China HBM Access Pulse for the domestic card. A 110% electronics P&L can print while the memory bind holds. That is the empty socket on this Pulse’s cover.
3. Energisable megawatts — the other stuck step, on the sibling. Power and heat profits fell 15.1%. Electrical machinery profits fell 5.2%. The Data-Services Pulse already showed internet data-services electricity at +37.9% against a record 1,560 GW peak. A louder electronics profit line does not connect a hall. Matching compute to power stays Power–Computing.
4. Not the auto row, and not “whoever announced another GPU.” Automobile manufacturing profits fell 16% even as Yu cited NEV-related chip demand. Volume without the scarce step does not keep the dollar. Announced domestic accelerators without HBM and without a connectable megawatt stay paper.
The pattern is the same as Taiwan and Korea, on a different object: the money sticks where the step is stuck. This week the cash is at copyable electronics. The stuck step is still advanced HBM — with power on the other clock.
Is advanced HBM still stuck?
Yes. The 28 September print is evidence that the electronics P&L is still compounding. It is not evidence that stacked memory inside the domestic card got cheaper, more available, or qualified on a leading AI package.
NBS’s own language is the caution. The chip-demand sentence is pinned to optoelectronic devices and semiconductor discrete devices. Discrete is not HBM. Opto is not CoWoS. Computer-whole profits up 3.9 times is a server-box cash step — the China cousin of Taiwan’s Foxconn/Quanta volume line, which keeps less of each dollar than the scarce packaging slot.
Two cautions before you read too much into “electronics +110%”:
- A contribution rate is not a node mix. 62% of the industrial increment can come from materials, discretes, opto and boxes. It does not mean China printed 7-nanometre-class logic at TSMC’s 67.7% gross margin.
- A PMI above 50 is not an HBM allocation. High-tech manufacturing at 52.5 on 30 September says the climate in that bucket is still expanding. It does not allocate Korean HBM or clear a CXMT-class stack.
If HBM access catches up — dated domestic HBM qualification on a shipping accelerator, or a Korea-door allocation that actually lands in China cards — the stuck step moves. Next candidates: energisable MW (already loud on the meter) and leading-edge wafers (still a Taiwan door). CoWoS remains Taiwan’s packaging bind.
What dates matter
The next clocks are another NBS profits print, the foundry mix we will not mix in, and the same power clock as last week.

The cash print is in. Scarce steps still sit on sibling clocks. Education only.
| Date | What | Why it matters |
|---|---|---|
| 28 Sep 2026 | NBS Jan–Aug industrial profits | This Pulse’s print. Electronics +109.9%; 62% of the jump. |
| 30 Sep 2026 | NBS official PMI | Manufacturing 50.1; high-tech 52.5. Twin, not the trigger. |
| ~27 Oct 2026 | NBS Jan–Sep industrial profits | Does electronics still carry ~60% of the increment? August alone had already cooled to +4.2% for all industry. |
| Open / TBC | SMIC Q3 2026 | Foundry mix. Do not staple to the NBS electronics line. |
| Around 20 Oct 2026 | NEA September electricity | Power sibling — data-services kWh, not this P&L. |
| 8 Oct 2026 | TSMC September revenue | Taiwan door — packaging still sets who ships leading chips. |
How is this different from last week’s China Pulses — and from Taiwan and Korea?
It is the same map. It is a different object.
The 28 September Data-Services Pulse mapped the meter: 10.2 TWh, +37.9%, record peak. This Pulse maps the P&L that sits next to those halls. Same week, two layers. Do not collapse 62% of industrial profit growth into 10.2 TWh.
The 22 September Power–Computing Pulse owns the cabinet instruction and the computing-electricity path. This Pulse does not rewrite it. Power and heat profits falling 15.1% is consistent with “the grid P&L is not where the scarce dollar sticks.”
The 19 September HBM Access Pulse still owns advanced memory inside the domestic card. Today’s NBS note is the evidence that the official chip-demand sentence still points at discrete and opto. That is why HBM remains the stuck step on this Pulse.
Taiwan’s door is still CoWoS. Korea’s door is still HBM allocation and chip output. Yesterday’s US Vera Rubin Pulse mapped live halls versus contracted power. China’s analog this morning is cash at electronics versus stacked memory that this table does not print.
- Electronics / high-tech manufacturers: paid on this P&L when mix holds.
- Domestic accelerator names: still on the HBM Access map, not on Yu’s discrete/opto sentence.
- Power / DC developers: still on the Data-Services / Power–Computing map.
What would change this view?
The “electronics gets paid / advanced HBM still stuck” read weakens if:
- [ ] NBS’s next profits note names integrated-circuit or HBM-class memory as the driver of the electronics increment, not discrete and opto
- [ ] A dated domestic HBM qualification prints on a shipping accelerator at scale
- [ ] Electronics contribution of the industrial increment falls toward its 16% stock share and high-tech profits cool into the teens
- [ ] Automobile manufacturing profits recover while electronics stalls — a mix reversal
- [ ] The next NEA monthly shows data-services electricity collapsing while this P&L stays loud — a sign the hall meter and the electronics cash have decoupled the other way
- [ ] A non-memory bottleneck (tools, CoWoS-class packaging, or energisable MW) becomes the louder primary constraint on who ships a China card
The view stays intact while electronics still carries most of the industrial profit jump, Yu’s mix stays on discrete/opto/materials/boxes, and HBM Access remains the bind inside the card.
Practical takeaways
- Name the stuck step: advanced HBM inside the domestic card — not “China electronics ran out of cash”
- Who gets paid: electronics (¥847.47bn, +109.9%), high-tech manufacturing (+54.7%), and the named sub-steps (opto, discrete, materials, circuits, computer wholes, fibre)
- Who waits: stacked memory (HBM Access) and energisable MW (Data-Services / Power–Computing)
- Our arithmetic: 62.0% of the increment, 16.1% of the stock, profit 5.5× sales growth, electronics gained 9.2× what autos lost
- Read beside HBM Access, Power–Computing, and the Data-Services meter — same country, four layers
- Next hard P&L: NBS January–September industrial profits, likely late October
FAQ
What did NBS print for China industrial profits in January–August 2026?
Scale-above industrial firms made ¥5,271.98 billion of profit, up 15.7% year on year. Computers, communications and other electronic equipment made ¥847.47 billion, up 109.9%. NBS posted the tables on 28 September 2026.
Who gets paid on this China electronics print?
The electronics P&L — and, inside Yu Weining’s note, optoelectronic devices, semiconductor discrete devices, electronic special materials, electronic circuits, computer wholes, peripherals and fibre. High-tech manufacturing profits rose 54.7%. Automobile manufacturing profits fell 16.0%; that row is not who gets paid.
Why is advanced HBM still the stuck step if electronics profits doubled?
Because the official mix points at discrete devices and optoelectronics, not stacked high-bandwidth memory. A 110% electronics profit print can happen at copyable steps while HBM access inside the domestic card stays the bind. See the China HBM Access Pulse.
How did you get 62% of the profit jump?
Our arithmetic: electronics implied 2025 profit ¥403.75 billion, increment ¥443.72 billion; all-industry increment ¥715.39 billion; 443.72 ÷ 715.39 = 62.0%. That matches Yu’s stated 62.0% contribution rate.
How is this different from the China Data-Services Power Pulse?
Data-Services (28 Sep) maps NEA’s August electricity mix — 10.2 TWh of internet data services, +37.9%. This Pulse maps NBS’s January–August industrial profits. Same week, different object. Power remains a sibling stuck step, not this table’s lead.
Is this a buy list of China electronics or semiconductor stocks?
No. This Pulse maps who gets paid and which step is stuck. It is education only, not a recommendation to buy or sell any security.
Keep reading on the map
- Explained: HBM · CoWoS · Speed-to-power · EUV
- Markets: China HBM Access · China Power–Computing · China Data-Services · Korea HBM mix · Taiwan TSMC revenue · US Vera Rubin · China Markets hub
- The Stack: Semiconductors · Hyperscalers · The Stack
Members’ Analysis. If electronics keeps carrying three-fifths of China’s industrial profit jump while the official mix stays on discrete, opto and boxes, the bottleneck on a China AI card is still stacked memory — not a missing P&L. Read the Analysis →
Get the Wire. Second Order’s free daily brief on what moved in the AI chip map. Subscribe free →
How we check this
Figures come from government releases, each dated in the list below. Capacity and timing from press reports are labelled as reported, not guided. Where we work something out ourselves, the arithmetic is shown in full and marked “our arithmetic.”
Last reviewed: 2 Oct 2026 · Next review: after the next NBS monthly industrial-profits print
Spot an error? Tell us and we will correct it and note the change here.
Sources
- NBS — Industrial profits of enterprises above designated size, January–August 2026 (28 Sep 2026)
- Yu Weining — interpretation of January–August 2026 industrial profits (28 Sep 2026)
- Xinhua / English.gov.cn — industrial profits retain double-digit growth (28 Sep 2026)
- NBS — China PMI, September 2026 (30 Sep 2026)
- Xinhua via People’s Daily — September PMIs; high-tech manufacturing 52.5 (1 Oct 2026)
- Second Order — China HBM Access Pulse (sibling · memory bind)
- Second Order — China Power–Computing Pulse (sibling · policy bind)
- Second Order — China Data-Services Power Pulse (sibling · meter bind)
Education only. Not investment advice. Do your own research. Second Order may correct figures if primary sources revise them — next planned refresh after the next dated NBS industrial-profits print.