HBM Toward 30% of DRAM Wafers: Who Gets Paid When Korea Allocates
September 2026 in one line: Samsung says HBM is headed toward nearly 30% of industry DRAM wafer capacity next year, from about 20% now — who gets paid is SK hynix and Samsung on allocated high-ASP HBM; the stuck step is wafer allocation away from commodity DRAM.
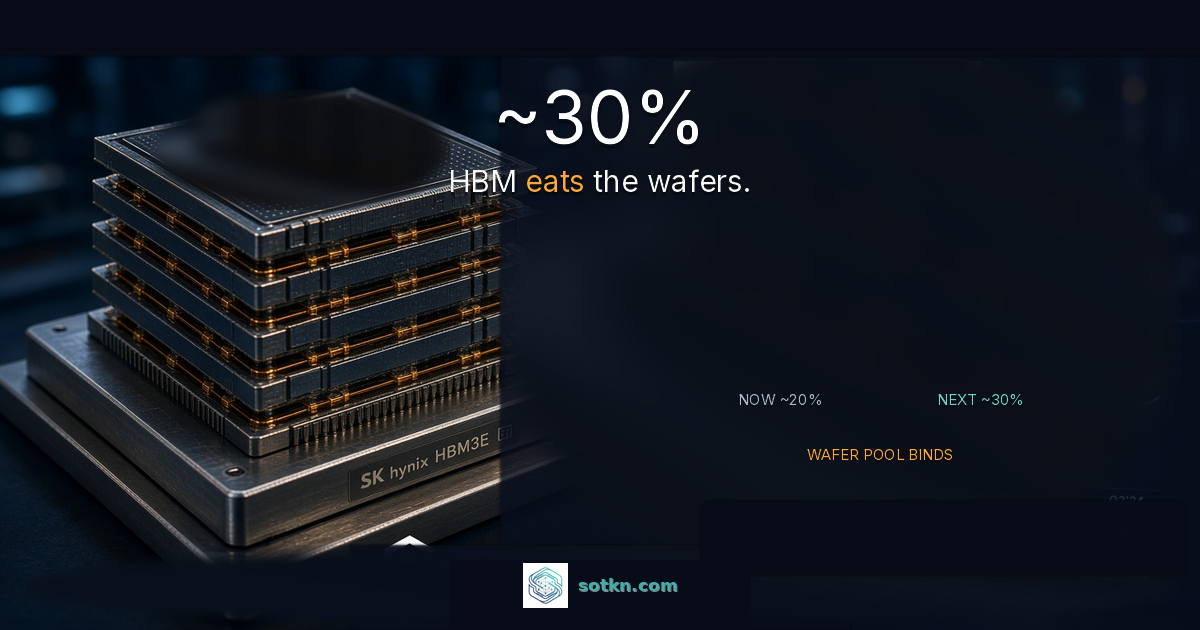
Samsung’s memory leadership just put a clean number on the industry wafer pool: HBM is expected to take nearly 30% of DRAM chipmakers’ wafer capacity next year, up from about 20% now. Who gets paid is SK hynix and Samsung on allocated high-ASP HBM. The stuck step is wafer capacity allocation between HBM and commodity DRAM — when HBM expands, commodity buyers share a smaller residual pool.
KOREA PULSE · Data as at 30 Sep 2026 · Next update: after Samsung / SK hynix Q3 2026 results (late Oct)
Affects: Semiconductors · Hyperscalers · Neoclouds — Markets: Korea · Taiwan · China · US
Education only, not advice to buy or sell any security. Mix and capacity figures from executive remarks and research notes are labelled as reported. Company IR is cited only where dated.
The numbers that matter this month
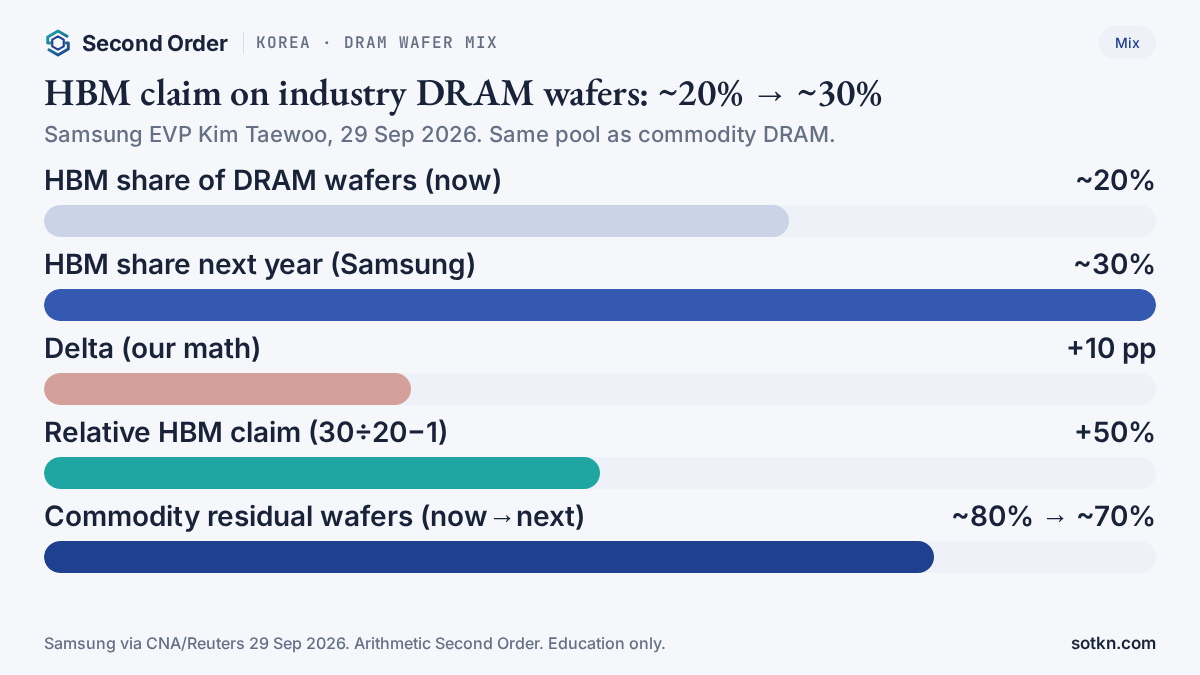
HBM share of industry DRAM wafers (now)
~20%
Samsung EVP Kim Taewoo · CNA/Reuters 29 Sep 2026
BaselineHBM share next year (Samsung)
nearly 30%
Same wafer pool as commodity DRAM — expanding HBM constrains supply
Mix printDelta (our arithmetic)
+10 pp
30 − 20 = 10 percentage points of industry DRAM wafers to HBM
Our mathRelative HBM claim (our arithmetic)
+50%
30 ÷ 20 − 1 = 50% larger HBM claim on the wafer pool
ScaleCommodity residual wafer share
~80% → ~70%
What is left for non-HBM DRAM after the mix shift
Stuck stepTrendForce top-3 HBM wafers / bits (EOY 2027)
~30% / ~13%
Vs ~22% / ~9% EOY 2026 — HBM eats wafers faster than bits
Density gapSources: Samsung via Channel News Asia / Reuters, 29 Sep 2026; TrendForce 2 Jun 2026 (top-3 wafer vs bit shares). Status chips are Second Order’s read. Arithmetic labelled ours.
On this page: Why Korea? · What changed · Our math · Where money sticks · Is allocation still stuck? · Dates next · How this differs · What would change this · FAQ
Why does Korea matter now?
Korea is still the AI memory door. Most high-bandwidth memory that sits beside an AI GPU is made by SK hynix and Samsung, with Micron as the third industrial supplier. Without those stacks, a leading-edge logic die from Taiwan cannot ship as a finished accelerator.
That is the same map we keep on the Korea Markets hub and in HBM, explained. Earlier Korea Pulses covered export prints, SK hynix allocation, and Samsung’s HBM4 yield unlock. This Pulse asks a different money question: what does an industry-wide shift of DRAM wafer capacity toward HBM — from about one-fifth to nearly one-third — do to who gets paid and who waits.
1 · Allocated HBM stacks
Who: SK hynix + Samsung (+ Micron)
Paid: High ASP on qualified stacks under customer LTAs
2 · Wafer capacity allocation
Who: Industry DRAM wafer pool
Paid: HBM share ~20%→~30%; commodity buyers share what is left
3 · Commodity DRAM ASP
Who: Server / PC / mobile buyers
Paid: Pay from a tighter residual wafer pool as HBM expands
4 · Package join (mostly Taiwan)
Who: CoWoS-class and peers
Paid: Attach still gates finished GPUs — neighbour door
Chain is Second Order’s map. Neighbours: Semiconductors stack · CoWoS explained · Taiwan TSMC / CoWoS Pulse · SK hynix HBM5–CoWoS Wire (28 Sep).
What changed
The fresh print is dated 29 Sep 2026. Channel News Asia and Reuters reported Samsung Electronics Executive Vice President Kim Taewoo saying high-bandwidth memory is expected to account for nearly 30% of DRAM chipmakers’ total wafer capacity next year, up from about 20% currently — and that HBM and standard DRAM compete for the same wafer capacity, so expanding HBM can constrain standard DRAM supply.
That is not a new company product launch. It is a capacity-mix statement from inside one of the three firms that set the industry wafer pool. The money question is who captures the high-ASP HBM hours when nearly a third of DRAM wafers are pointed that way — and what happens to everyone who still needs commodity DRAM bits from the residual.
- Samsung (29 Sep 2026): HBM ≈ nearly 30% of industry DRAM wafer capacity next year
- Samsung: baseline about 20% of industry DRAM wafer capacity today
- Samsung: HBM and standard DRAM share the same wafer capacity
- Market frame: SK hynix, Samsung, and Micron dominate HBM supply
Same-day research support, not the main thesis: TrendForce (29 Sep 2026) reiterated that HBM and conventional DRAM still compete for limited advanced-process and wafer capacity into 2027, and raised its 2027 blended HBM ASP outlook (+121% YoY forecast) as suppliers lean into pricing power. Optional architecture context from the same Seoul day — Samsung’s zHBM keynote at Herald Business Forum (4–8× leap targets vs a conventional generation) — is a co-design path, not this capacity-mix print.
Same-week Second Order neighbour (do not re-litigate here): SK hynix HBM5–CoWoS validation / Partner of the Year Wire (28 Sep) sits on the Taiwan attach door. This Pulse stays on the Korea wafer-pool mix.
Our math — labelled our arithmetic
Take Samsung’s two industry-share figures at face value and subtract. Add the relative claim and the residual commodity share. That is the only original arithmetic in this Pulse.
Our arithmetic — HBM claim on the DRAM wafer pool
Inputs: Samsung via CNA/Reuters, 29 Sep 2026. Arithmetic is Second Order’s. These are executive remarks on industry mix, not Samsung formal IR guidance.
What this tells you: on Samsung’s industry frame, HBM’s claim on the DRAM wafer pool is half again as large next year as it is now, and commodity DRAM’s residual share of that pool shrinks by ten percentage points. What it does not tell you: exact stack shipments by customer, exact yield paths, or whether every planned wafer start lands.
Cross-check with research density math. TrendForce (2 Jun 2026) estimated HBM wafer input among the top three suppliers at about 18%, 22%, and 30% of total DRAM wafer input by end-2025, 2026, and 2027 — while HBM bit supply was only about 8%, 9%, and 13% of DRAM bits. The gap is the point: larger dies, stacking, TSV processing, and yield loss mean HBM consumes wafers faster than it adds DRAM bits.
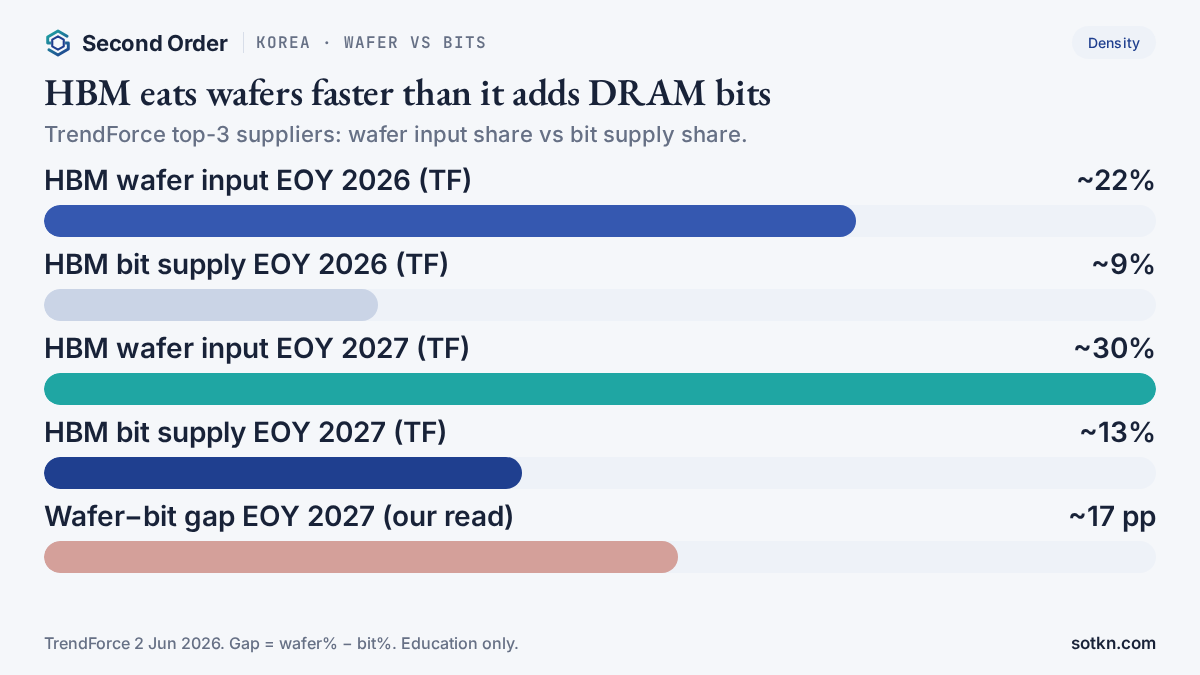
TrendForce top-3 — wafer share vs bit share
TrendForce 2 Jun 2026. Gap arithmetic is Second Order’s read of those published shares.
Supply-balance colour from TrendForce (30 Jul 2026): DRAM sufficiency around −1% to −2% in 2026, with the shortage expected to widen in 2027 as HBM allocation and AI server demand keep conventional DRAM tight. That is the pricing side of a residual pool that is getting smaller relative to HBM’s claim.
Where does the money stick?
Cash sticks where capacity is scarce relative to demand. In this Korea read, that is not “does HBM exist?” — it is which wafers feed allocated HBM first, and who pays from the residual commodity pool.
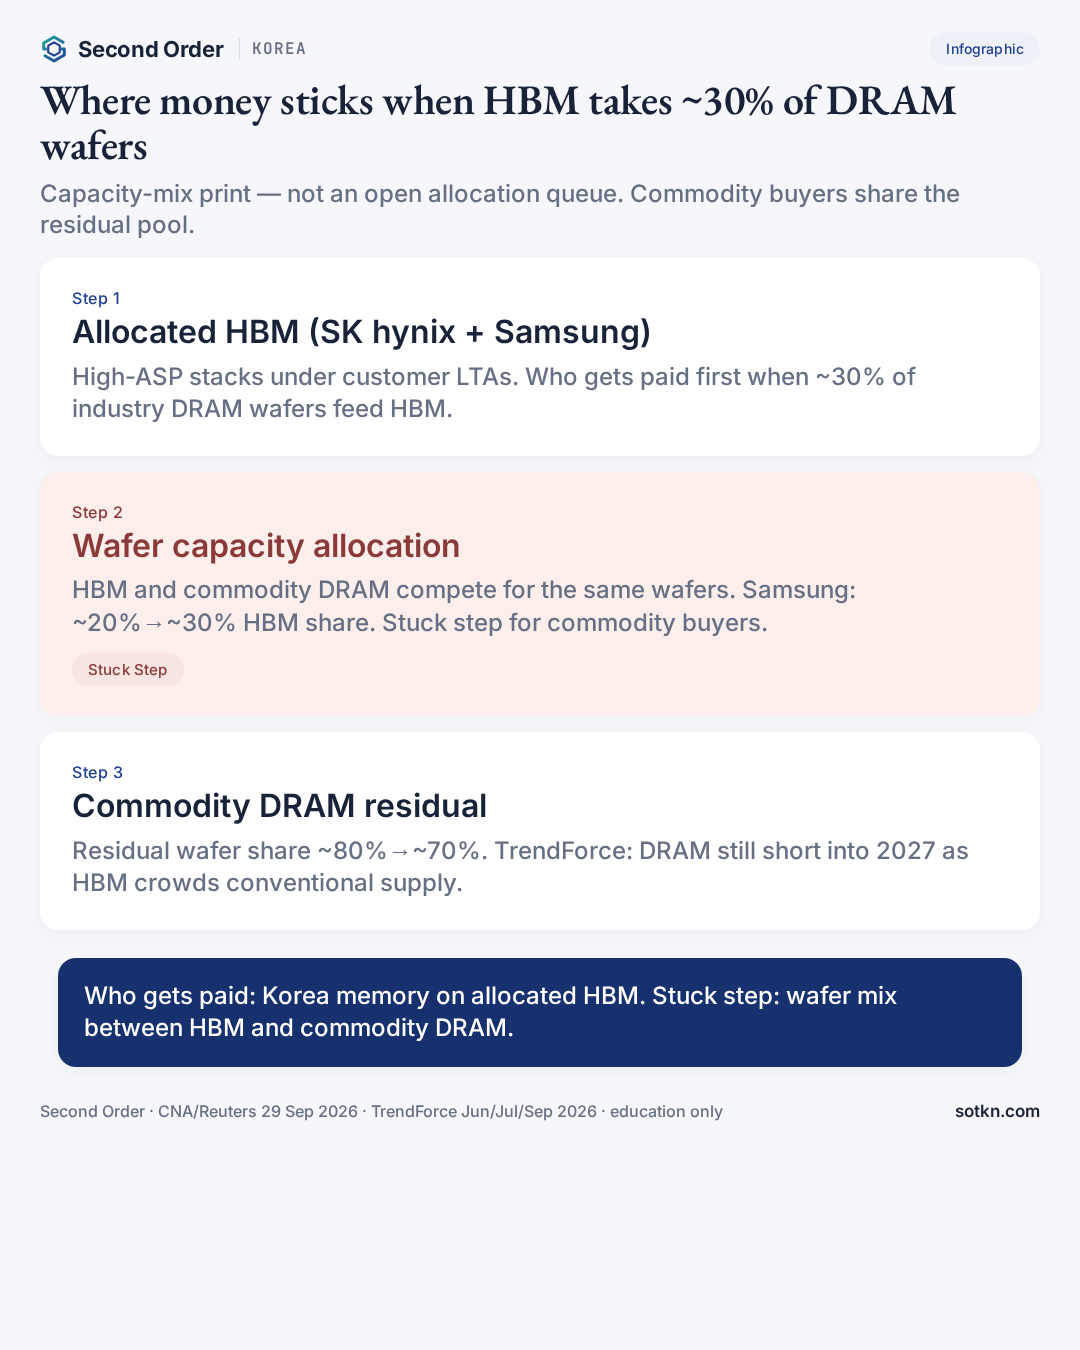
- Step 1 — Allocated HBM stacks: SK hynix and Samsung invoice high ASP under customer agreements. A larger industry wafer share aimed at HBM supports that invoice path.
- Step 2 — Wafer capacity allocation (stuck): HBM and commodity DRAM share one pool. Samsung’s ~20%→~30% industry frame is the mix print; commodity buyers wait on what is left.
- Step 3 — Commodity DRAM ASP: A smaller residual wafer share supports firm contract prices while TrendForce still sees DRAM short into 2027.
One-line rule: when HBM’s share of industry DRAM wafers rises toward one-third, the margin migrates to allocated HBM — and the queue migrates to everyone who needed those wafers for commodity DRAM.
Is wafer allocation still stuck?
Yes for commodity buyers — until dated evidence shows HBM’s wafer claim stopping short of crowding them out, or new greenfield DRAM capacity landing early enough to refill the residual pool. HBM suppliers’ own allocated path looks like the paying step; the scarcity for other DRAM buyers is the share of wafers that left with HBM.
Stuck-step scorecard (Sep 2026)
Status is Second Order’s read from Samsung 29 Sep 2026 and TrendForce Jun/Jul/Sep 2026. Caution: mix figures are executive / research estimates, not a single IR slide.
For the allocation-centred Korea story — SK hynix margins, LTA customer lists — stay on Korea HBM Pulse and SK hynix HBM allocation. For Samsung’s company-level yield unlock and wafer/SF4 shift, use Samsung HBM4 yield Pulse. For the packaging neighbour, use Taiwan TSMC revenue / CoWoS and CoWoS explained.
What dates matter
The next hard prints are Q3 results late October 2026. Listen for HBM mix language, wafer-start commentary, and whether management echoes the ~30% industry wafer frame — not for daily share noise.
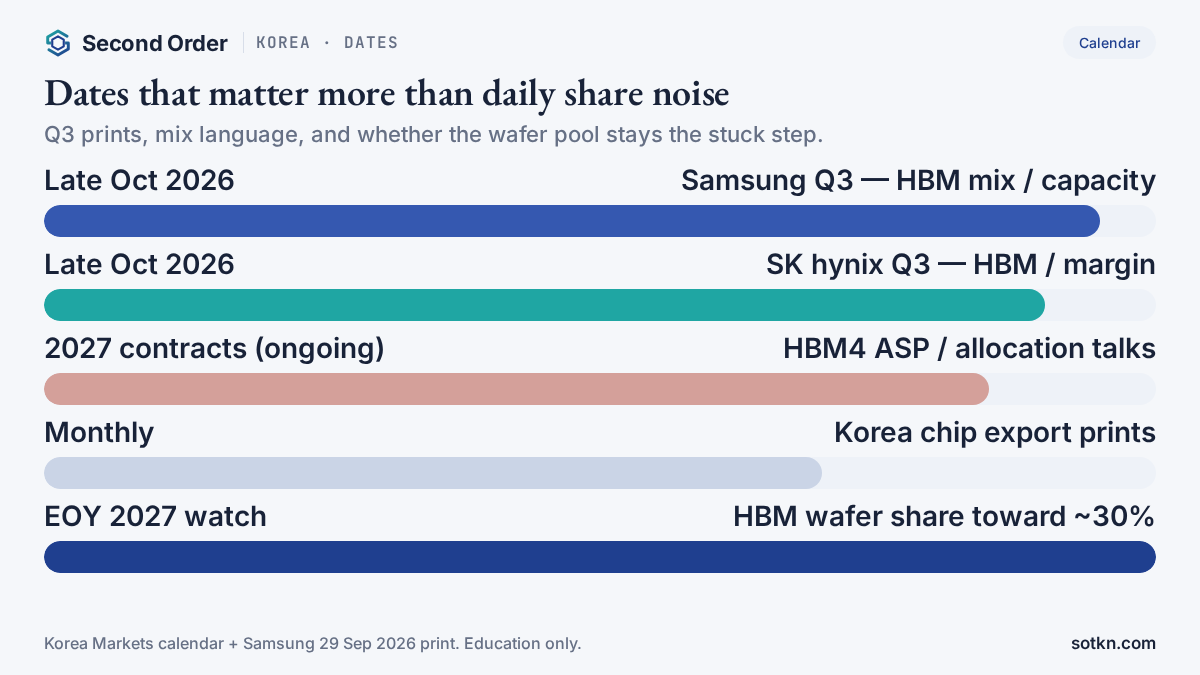
Calendar
How is this different from earlier Korea Pulses?
Same door, different stuck-step lens. Do not collapse these into one HBM story.
- Korea chip exports (24 Sep): Customs cash print — $34.128bn 1–20 Sep. Demand/export lens, not wafer mix.
- Samsung HBM4 yield (21 Sep): Company yield unlock near 80% and Samsung wafer/SF4 reallocation.
- Korea HBM memory (17 Sep): Allocation and margins — who is still on the short customer list.
- SK hynix allocation (evergreen): Allocation cycle as the Korea memory door’s recurring structure.
- This Pulse (30 Sep): Industry DRAM wafer capacity mix — HBM ~20%→~30%. Capacity-mix print.
Sibling links: exports Pulse · HBM4 yield Pulse · HBM allocation Pulse · SK hynix allocation. Last Markets rotation was Taiwan capex split (29 Sep); next after this Korea door is US.
What would change this view?
- Credible Samsung / industry IR showing HBM wafer share flat while commodity DRAM supply loosens
- Greenfield DRAM capacity landing early enough to refill the residual pool in 2027
- Conventional DRAM contracts falling QoQ for two quarters while HBM ASP holds
- Architecture shift that cuts HBM intensity per unit of useful compute without freeing wafers
- Hyperscaler / neocloud demand pause that frees HBM wafers back to commodity without new fabs
- TrendForce / peers revising HBM wafer-share paths meaningfully below the ~30% band
The view stays intact while the ~20%→~30% industry wafer frame holds, HBM and commodity DRAM still share one pool, and research still shows DRAM short into 2027.
Practical takeaways
- Name the stuck step: wafer capacity allocation between HBM and commodity DRAM
- Samsung 29 Sep 2026: HBM toward nearly 30% of industry DRAM wafers next year, from ~20%
- Our arithmetic: +10 pp absolute, +50% relative HBM claim, commodity residual ~80%→~70%
- TrendForce: ~30% wafers / ~13% bits EOY 2027 — HBM eats wafers faster than bits
- Read beside yield / allocation / exports Pulses — same door, different lens
How international readers get exposure (roles only)
Examples of exposure roles only — not recommendations. Samsung Electronics (005930.KS) and SK hynix sit on the Korea memory door; Micron is the third HBM supplier often accessed via US listing. Always verify ticker, ADR, and tax treatment for your jurisdiction. Where a broker account is useful for international access, some readers use Interactive Brokers — soft link only, never a hard sell.
FAQ
What did Samsung say about HBM and DRAM wafer capacity?
On 29 Sep 2026, Samsung Electronics EVP Kim Taewoo said HBM is expected to account for nearly 30% of DRAM chipmakers’ total wafer capacity next year, up from about 20% now. He noted HBM and standard DRAM compete for the same wafers.
Is a 30% HBM wafer share the same as 30% of DRAM bits?
No. TrendForce estimates HBM can take ~22–30% of top-three DRAM wafer input while supplying only ~9–13% of DRAM bits, because HBM dies are larger, stacked, and lose more to TSV/yield. Wafer share is the capacity-mix print; bit share is smaller.
Who gets paid in this Korea read?
SK hynix and Samsung on allocated high-ASP HBM stacks under customer agreements. Micron is the third supplier in the same industrial frame. This is a map of who gets paid — not a buy list.
What is the stuck step?
Wafer capacity allocation between HBM and commodity DRAM. As HBM’s share of industry DRAM wafers rises toward ~30%, commodity buyers compete for a smaller residual pool.
How is this different from the Samsung HBM4 yield Pulse?
The 21 Sep Pulse centred on Samsung’s HBM4 yield near 80% and a company-level wafer/SF4 shift. This Pulse centres on an industry-wide capacity-mix print (~20%→~30% HBM wafer share).
Is this investment advice?
No. Education only. It maps who gets paid and which step is stuck. It is not a recommendation to buy or sell any security.
Keep reading on the map
- HBM explained · CoWoS explained
- Korea HBM Pulse (allocation) · Samsung HBM4 yield Pulse · Korea Markets hub
- Taiwan TSMC / CoWoS Pulse · China HBM access Pulse
- Semiconductors stack · Hyperscalers · Analysis · Wire
How we check this
Figures come from company executive remarks and dated research notes in the list below. Capacity and mix language from press are labelled as reported, not guided. Where we work something out ourselves, the arithmetic is shown in full and labelled our arithmetic.
Last reviewed: 30 Sep 2026 · Next review: after Samsung / SK hynix Q3 2026 results
Spot an error? Tell us and we will correct it and note the change here.
Sources
- Channel News Asia — Samsung: HBM nearly 30% of industry DRAM capacity next year (29 Sep 2026)
- Reuters via MarketScreener — same print (Kim Taewoo) (29 Sep 2026)
- TrendForce — HBM supply constraints; 2027 ASP outlook raised (29 Sep 2026)
- TrendForce — HBM wafer input ~18/22/30%; bit supply ~8/9/13% (2 Jun 2026)
- TrendForce — DRAM sufficiency tight into 2027 (30 Jul 2026)
- Herald Business — Samsung zHBM keynote (optional architecture context) (29 Sep 2026)
- Second Order — SK hynix HBM5–CoWoS Wire (28 Sep, neighbour)
- Second Order — Samsung HBM4 yield Pulse · Korea HBM Pulse · Korea exports Pulse
Education only. Not investment advice. Do your own research. Second Order may correct figures if primary sources revise them — next planned refresh after Samsung / SK hynix Q3 2026 results.