
Compute Up 146%, Power Use Up 35%: Who Gets Paid While China's New AI Racks Wait for Work
China's official AI compute count rose 146% in a year, to 2,592 EFLOPS. The power used by its data services rose 35% in September. Chips and racks are being installed faster than paying work reaches them. That is the stuck step.

China counts its AI computing power the way a builder counts houses: by what has been put up. On 20 October the industry ministry said the count had reached 2,592 EFLOPS, up 146% in a year. A day later the energy regulator printed a different kind of number: the electricity its data services actually used. That rose 35% in September. One number counts the chips and racks that are installed. The other is closer to a meter on the work they do. The count is running well ahead of the meter. The stuck step is the paying hour: work that reaches the new racks and keeps them busy.
CHINA PULSE · AI DATA CENTERS · SEMICONDUCTORS · Data as at 25 Oct 2026 · Next update: Inspur and Moore Threads third-quarter results, 29 Oct
Affects: AI Data Centers · Semiconductors · Hyperscalers — Markets: China · US · Taiwan
Education only, not advice to buy or sell any security. Figures are as published by China’s industry ministry and National Energy Administration, local governments, CAICT and IDC, unless another source is named. Our own sums are labelled.
The numbers that matter this week
China intelligent compute, end-September
2,592 EFLOPS
+146% y/y · MIIT, 20 Oct
SurgingAdded in the third quarter
~407 EFLOPS
From 2,185 at end-June (our arithmetic)
Still addingData services power use, September
9.8bn kWh
+35.4% y/y · NEA, 21 Oct
SlowerData services power use, Jan–Sep
79.3bn kWh
+41.6% y/y · about 1% of all power
SlowerRack fill rate, end-June
71.4%
About 29% of built rack space empty
GapWork reaching the new racks
Lagging
Count +146% vs meter +35% · our read
Stuck stepFigures from China’s industry ministry (20 Oct 2026 briefing; end-June figures reported 26 Jul 2026) and the National Energy Administration (21 Oct and 20 Sep 2026). Quarterly additions and shares are our arithmetic. Status chips are Second Order’s read.
On this page: Why it matters · What Beijing published · What the count counts · What the meter says · Why the gap · The empty racks · The western hubs · Whose chips · Is there enough work? · Our math · Who gets paid · What is stuck? · Dates next · What would change this · FAQ
Why does China's compute count matter to who gets paid?
Because the count is a bill that has already been paid. Every EFLOPS in the ministry’s figure is a chip that someone bought, a server that someone built, a rack that someone installed and a hall that someone wired. The chipmakers, server makers and builders were paid when that happened. Whether anyone else gets paid depends on what comes next: whether work arrives to keep those chips busy.
A data hall earns its money by the hour of use. A chip that sits idle earns nothing for its owner and gets older every month. So the question is not only how much has been built. It is how much of it is working.
China does not publish a national figure for how busy its AI chips are. But it publishes two numbers that, read side by side, give a fair hint. One is the compute count. The other is the electricity used by the industry that runs data services. Electricity is a good witness. A busy chip draws far more power than an idle one, and power bills are hard to fake.
1 · The chip
Who: Huawei, T-Head, Cambricon, Kunlunxin, Hygon and Nvidia ship accelerators
Paid: Paid at sale · 2.0m units in the first half
2 · The build
Who: Server makers, optics and builders put chips into racks and halls
Paid: Paid at install · count +146%
3 · The work
Who: Model makers, apps and firms send jobs to the racks
Paid: Racks 71% filled · meter +35%
4 · The meter
Who: Hall owners and power sellers are paid by the hour used
Paid: Paid on use, not on count
What did Beijing publish on 20 and 21 October?
On 20 October the State Council Information Office held its quarterly briefing on industry and technology. Xie Cun, who runs the industry ministry’s telecoms bureau, said China’s intelligent computing power had reached 2,592 EFLOPS at the end of September, up 146% from a year earlier. He said the ministry would speed up expanding and improving computing facilities, and would push ahead with building what it calls a compute marketplace, a place to buy and sell computing time much as you would buy goods in a shop.
On 21 October the National Energy Administration printed September’s power use. China used 899.7 billion kWh in the month, up 1.2%; household use fell 6% after a typhoon cut air-conditioning in the south and east. Two groups stood out. Charging for electric cars rose 57%. Internet data services, the class that holds most of the country’s data centres, used 9.8 billion kWh, up 35.4%. For the first nine months, data services used 79.3 billion kWh, up 41.6%.
What does 2,592 EFLOPS actually count?
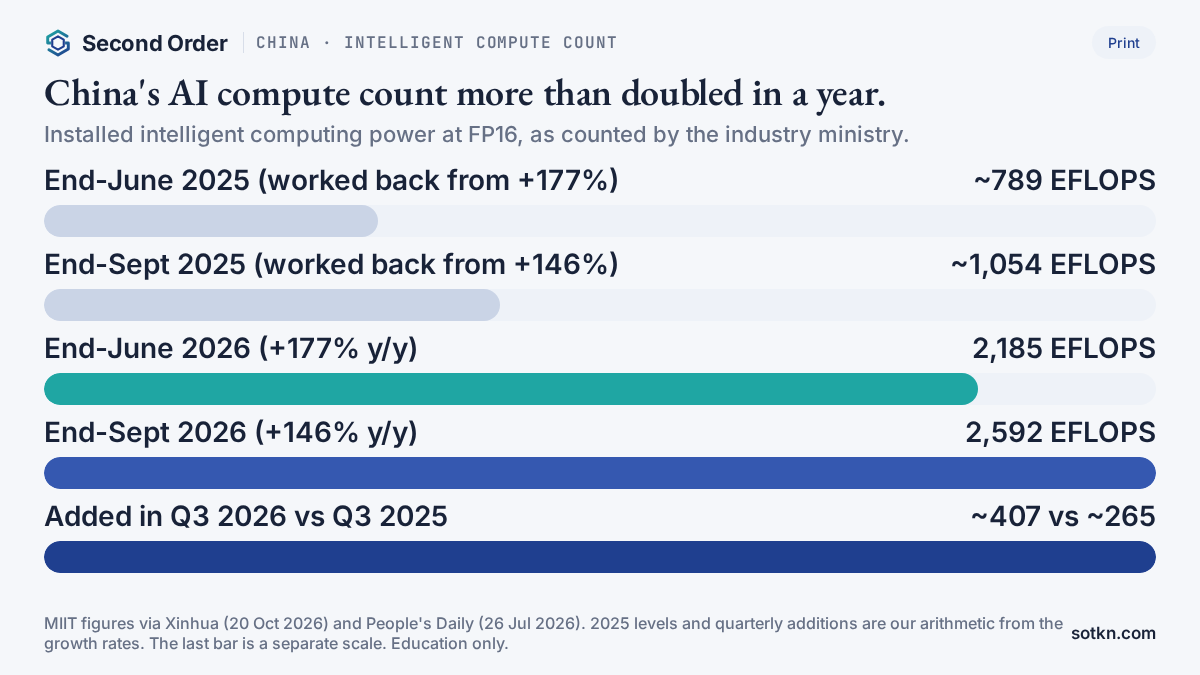
An EFLOPS is a billion billion sums a second. The ministry counts it at a standard precision used for AI work, known as FP16, and it adds up the peak speed of the AI chips that are installed in computing facilities across the country. It is a measure of what the hardware could do flat out, not of what it is doing.
The path is steep. At the end of June the count was 2,185 EFLOPS, up 177% from a year before. By the end of September it was 2,592. A year earlier, working back from the 146% growth rate, it was about 1,054. So China added about 1,538 EFLOPS in twelve months, and about 407 in the third quarter alone (our arithmetic).
The growth rate is easing, from 177% to 146%, but only because the base is now so big. In plain amounts, the build is still speeding up. A year ago, between June and September 2025, the count rose by about 265 EFLOPS. This year the same three months added about 407, roughly one and a half times as much (our arithmetic).
Some of that is the new domestic hardware we have followed this month. Huawei’s first 10,000-card pool of Ascend 950DT chips is due for handover at China Telecom’s Inner Mongolia park by the end of October (Ascend 950DT Pulse). Cambricon’s third-quarter sales doubled while its stock of chips and parts grew (Cambricon Catalyst). Hygon’s nine-month sales rose 58% (Hygon Pulse). Each chip sold and installed adds to the count.
What does the power meter say?
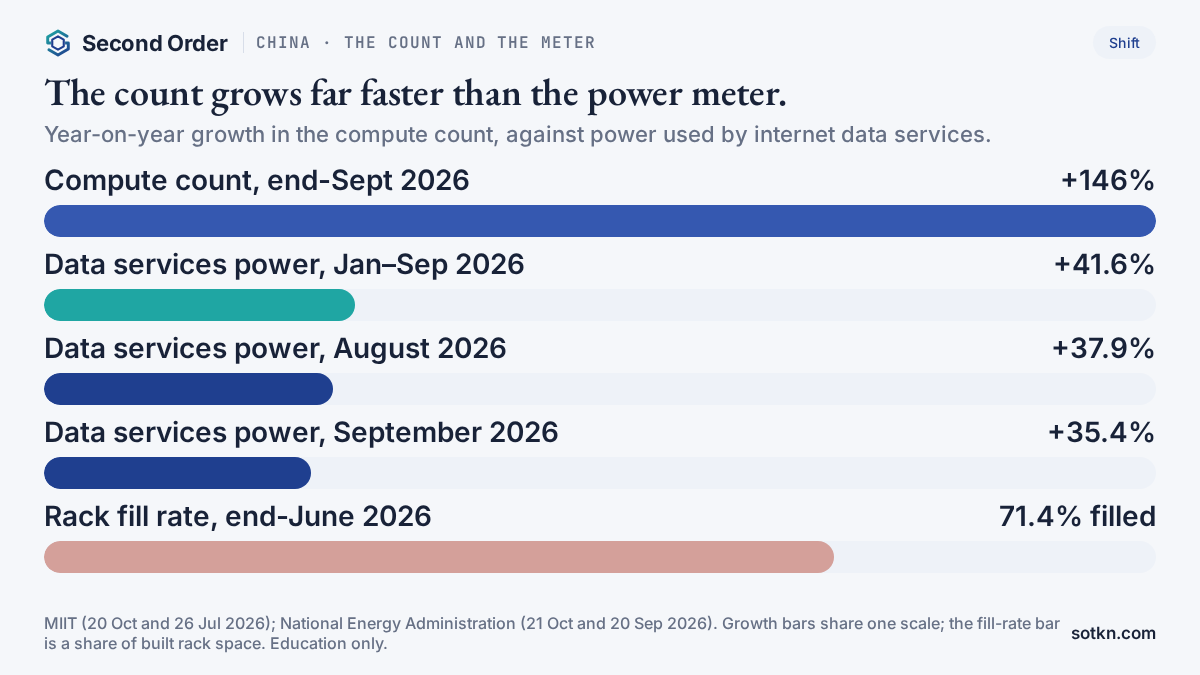
The power numbers are growing fast by any normal yardstick. Data services used 79.3 billion kWh in the first nine months of 2026, about 56 billion a year earlier (our arithmetic). That is about one unit of every hundred that China used in total. It grew ten times as fast as the country’s overall power use, which rose 3.9%.
But the growth is slowing. In the first eight months it was 42.5%. In August alone it was 37.9%. In September it was 35.4%. Measured per day, August and September were about the same: roughly 329 million kWh a day in August and 327 million in September (our arithmetic). The meter is still rising year on year, but it did not climb between those two months.
Turn the September figure into a steady load and it is easier to picture. 9.8 billion kWh over 30 days is about 13.6 gigawatts running all month, on average. A year earlier it was about 10.1 gigawatts (our arithmetic). So in a year China added about 3.5 gigawatts of steady data-service load. That is a lot of power. It is also a lot less than a count that went up nearly two and a half times would suggest, if everything were busy.
Why is the count running ahead of the meter?
There are three reasons, and it is worth being fair about each, because only one of them is the stuck step.
First, newer chips do more sums for each unit of power. A chip from 2026 can do far more FP16 sums per watt than one from 2023. So when old chips are joined by new ones, the count can rise much faster than the power bill even if every chip is busy. This is real and it is a good thing. It explains part of the gap, not all of it.
Second, the power class does not cover everything. Some AI computing sits with carriers, government bodies or firms in other industries, and its power may be counted elsewhere. So the two numbers show direction. They are not close enough to divide one by the other and call it a usage rate.
Third, some of what is installed is not busy. A chip that has been bought and racked but has no work to run draws a fraction of its full power. It adds to the count at full value and to the meter at a fraction. This is the part that matters for who gets paid, because an idle chip earns nothing for whoever owns it.
Put simply: for each unit of power, the count now carries about 82% more compute than a year ago (2.46 divided by 1.354, our arithmetic). Better chips explain a good share of that. The rest is the gap between what has been built and what is being used. The official numbers do not let anyone split it exactly. The next section is the closest thing China publishes to a direct answer.
How many racks are built but empty?
When the ministry published the end-June count in July, it added one more number: the national rack fill rate, the share of built rack space that actually has equipment in it, was 71.4%. Turn it round and about 29% of the rack space in China’s computing facilities stood empty in June.
That figure is about racks, not chips. A filled rack can still be idle, and an empty rack costs its owner less than an idle chip. But it tells you that China builds the shell ahead of the work. The building, the power line and the cooling are put in first. The servers follow when there is a buyer. Nearly three racks in ten were still waiting for one.
We have seen this pattern in other markets too. In the US, firms with power and halls still wait for a tenant (IREN Spain Wire). Our signed-leases Analysis looked at what happens to cash when handover runs late. In China the twist is that the chips are often already bought too.
What do the western hubs say?
Much of the new compute is going west, to the national hubs set up under China’s East Data, West Computing plan, where land and power are cheap and the air is cool. Two of them published fresh numbers this week.
Qingyang, in Gansu, said on 20 October that its cluster had reached 306,000P, up 168% from 114,000P at the end of 2025, two months ahead of its target for the year. P here means PFLOPS, so that is about 306 EFLOPS on its own yardstick. The city says its halls handle about 12 trillion tokens a day for model makers, that more than 85% of its power comes from clean sources, and that it set up a RMB5 billion fund in August with a provincial finance group to back more compute, scheduling and AI use. It says gigawatt-scale campuses are on the way.
Ulanqab, in Inner Mongolia, said its running compute had reached 190,000P by mid-October, up 112% in a year, with more than 95% of it for AI. It has signed 109 data-centre projects with more than 7 million racks between them. Power for computing projects costs RMB0.32 to RMB0.36 per kWh, and it says total running costs are 30% to 50% below the big eastern cities, and two direct fibre routes put it 2.1 milliseconds from Beijing. In August, firms signed plans for more than 5 gigawatts of AI halls in one district alone. The report says DeepSeek plans a gigawatt-scale centre there with at least 160,000 domestic AI chips, and that GDS has said it will invest more than RMB30 billion over five years.
If both cities used the national yardstick, they would hold about 12% and 7% of the national count between them (our arithmetic). Local and national counts may not be measured the same way, so treat that as a rough guide. The point is clear either way: the hubs are adding capacity faster than the country as a whole, and they are lining up much more.
Both cities now talk less about building and more about selling: Ulanqab of a “city of tokens”, Qingyang of a token factory. They know a hall full of chips is only half a business. The other half is a buyer.
For why halls go where the power is, and what that means for distance to users, see our Explained page on where AI data centers are located.
Whose chips are filling the racks?
IDC, a research firm, counted about 2.01 million AI accelerators shipped into China’s data centres in the first half of 2026. Nvidia shipped about 678,000, down 44%, for a 34% share. Huawei shipped about 572,000, up from more than 300,000 a year before, for 28%. Alibaba’s chip unit T-Head had 7%, Cambricon 5%, Baidu’s Kunlunxin 4% and Hygon 3%.
For the first time, chips that are not GPUs outsold GPUs: about 1.02 million against 0.99 million. GPUs fell 26%, held back by US export rules on what Nvidia may sell. The others rose nearly 80%. Huawei, T-Head, Kunlunxin and Cambricon made about 95% of those, and IDC said governments, internet firms and telecoms carriers were the buyers. Together the five Chinese makers named held about 47% of shipments, well ahead of Nvidia’s 34% (our arithmetic). IDC expects total shipments to grow 19% this year, with GPUs down 9%.
This matters for the gap. Much of the new count is domestic chips bought by carriers and state-linked buyers. Buying is one decision; using is another. Model makers choose where to run work on speed, cost and software, and domestic chips are still catching up.
We have covered the supply side of this in detail: memory for these chips (Hygon and HBM), server memory from CXMT (CXMT Pulse) and power chips for the racks (8-inch power foundry Pulse). This Pulse is about the other end: whether the chips, once in place, find work.
Is there enough work to fill them?
Demand is not the problem in general. On 23 October CAICT, the ministry’s research arm, and an industry alliance published a report on how China’s AI models are served. It said daily token use in June was about 500 trillion, nearly four times the level of December 2025. A token is a small piece of text that a model reads or writes. That is a lot of work, and it is growing faster than the compute count.
The same report gives a clue about the gap. In August, Chinese models put out an average of 78.23 tokens a second, twice the 2025 average of 38.25. Typical foreign models managed 112.82. So Chinese services ran at about 69% of the speed of foreign ones (our arithmetic). The first token took about 1.26 seconds to appear, on average.
Speed is partly about the chips and partly about the software that runs on them. A buyer who wants fast answers for many users at once goes to the racks that deliver them: the best-tuned clusters, often near the big eastern cities, often on the most proven hardware. Work does not spread evenly across every installed chip. It piles onto the ones that serve it best. The rest wait.
That is why the meter lags the count even while token use soars. The work exists. It is not reaching every new rack. Our explainer on AI tokens versus GPU hours shows how the same chip can earn very different amounts depending on how it is sold, and our page on reserved versus on-demand GPUs shows who carries the cost of the idle hour.
The ministry’s answer is its planned compute marketplace: pool spare capacity across halls and sell it in small pieces. Whether it works depends on the same things: speed, software and distance.
Our math: what do the numbers say?
- Compute a year ago: 2,592 divided by 2.46 is about 1,054 EFLOPS at end-September 2025. Added in a year: about 1,538 EFLOPS (our arithmetic).
- Third quarter: 2,592 less 2,185 is about 407 EFLOPS, or 18.6% in three months. The same quarter of 2025 added about 265 (2,185 divided by 2.77 is about 789 at end-June 2025), so this year’s quarter added about 1.5 times as much (our arithmetic).
- Power: 79.3 billion kWh is up 41.6%, so the first nine months of 2025 were about 56.0 billion. September 2025 was about 7.24 billion; August 2025 about 7.40 billion (our arithmetic).
- Steady load: 9.8 billion kWh over 720 hours is about 13.6 GW; 7.24 billion is about 10.1 GW. About 3.5 GW added in a year (our arithmetic).
- Count per unit of power: 2.46 divided by 1.354 is about 1.82, so about 82% more counted compute per kWh than a year ago. Better chips explain part of that (our arithmetic and read).
- Power bill for a busy hall: 100 MW running all year is 876 million kWh. At Ulanqab’s RMB0.32 to RMB0.36 per kWh that is about RMB280 million to RMB315 million a year, paid only if the chips are busy (our arithmetic; an illustration, not a reported figure).
What this tells you: China is installing AI hardware faster than ever in plain amounts, and demand for AI work is rising fast. But the power meter, the best public witness to how busy the hardware is, is rising far more slowly and flattened between August and September. The gap is partly better chips and partly racks and chips waiting for work.
Who gets paid first?

First, the chipmakers — at the sale. Huawei, T-Head, Cambricon, Kunlunxin and Hygon, and Nvidia where it may still sell, are paid when the chip is bought, not when it is used. A build that runs ahead of demand is good for them for as long as buyers keep buying. Their risk comes later, if owners with idle chips slow their next orders.
Second, the server makers, optics and builders — at install. Firms that assemble servers, supply cables and modules, fit power and cooling and put up halls are paid as the count rises. The ministry’s promise to keep expanding facilities, and the hubs’ gigawatt plans, keep their order books full.
Third, the power sellers in the west — by the kWh used. Wind and solar developers with direct lines to halls, and the grid that carries their power, are paid on the meter, not the count. Their income from data services rose about 35% to 42% this year, which is very good, but it tracks use. More empty or idle racks mean less power sold than the build implies.
Fourth, the hall owners and cloud sellers — when the work arrives. China’s carriers, the big cloud firms and independent operators carry the cost of halls and, often, the chips inside them. They are paid by the hour of use or by the rack filled. A 71% fill rate and a meter that grows slower than the count tell you this is where the wait sits.
Last, the ones who wait longest: lenders and local funds that backed the shells, and owners of older chips that newer ones outrun. For how hall owners borrow before the income starts, see our data center financing explainer; for why an idle chip still costs money every month, see capex vs depreciation.
One-line rule: in China’s compute build, chipmakers and builders are paid at install; power sellers and hall owners are paid on use; and the count runs ahead of use. The stuck step is the paying hour.
So what is the stuck step?
The paying hour: the step where a real job from a real buyer lands on an installed chip and keeps it busy. Not chips, which are shipping in record numbers. Not halls or power, which the western hubs have in plenty and at low prices. Not demand in total, which has grown fourfold in six months. Three things make it stick:
- Work goes to the best racks. Buyers send jobs to the fastest, best-tuned clusters. Chinese model services still run at about 69% of foreign speed, so software and tuning decide where the work lands.
- Distance still matters. Much of the new capacity is far west, while many users are in the east. A 2.1 millisecond link helps, but not every hub has one.
- Buying is planned, using is chosen. Many domestic chips are bought by state-linked buyers. Model makers and app builders choose where to run each day.
This is a slower bind than a missing part, because it is about habits, software and contracts. It is also the kind our stuck-step Analysis says comes next once supply is solved: when chips, power and halls are no longer short, the bind moves to the buyer.
Which dates test this read next?
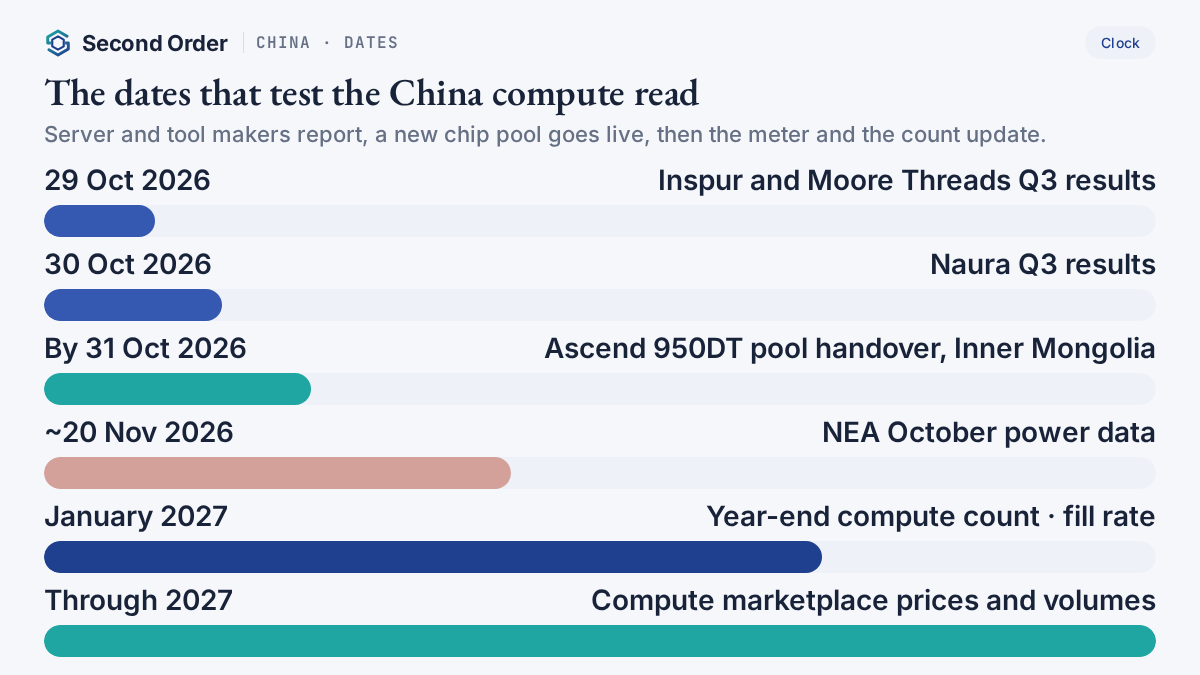
- 29 October 2026 — Inspur Information and Moore Threads third-quarter results. Inspur builds many of China’s AI servers; watch whether orders and shipments keep pace with the count.
- 30 October 2026 — Naura third-quarter results. China’s largest chip-tool maker shows how fast domestic chip capacity is still being built.
- By 31 October 2026 — Handover of the first Ascend 950DT 10,000-card pool at China Telecom’s Inner Mongolia park. A big new block of count; the test is whether it is put to work.
- Around 20 November 2026 — National Energy Administration October power data. If data services growth keeps slowing, the gap is widening; if it picks up, the work is arriving.
- January 2027 — Industry ministry briefing with the year-end compute count, and any new rack fill rate. A fill rate above 71.4% would mean racks are filling faster than they are being built.
- Through 2027 — The compute marketplace. Watch for prices and volumes of computing time sold through it.
What would change this view?
- The meter speeds up. If data services power growth climbs back above 40% while the count keeps growing, work is catching up with the racks.
- The fill rate rises. A new national rack fill rate well above 71.4% would mean the empty shells are being filled.
- Chips explain it all. If evidence shows newer chips account for most of the gap, idle capacity is smaller than we think and our read is too strong.
- Domestic speed catches up. If Chinese model services close the speed gap, work spreads to more of the new racks.
Practical takeaways
- China’s official AI compute count reached 2,592 EFLOPS at end-September, up 146%, with about 407 EFLOPS added in the third quarter
- Power used by data services rose 35.4% in September and 41.6% in nine months, and was flat per day between August and September
- About 29% of built rack space was empty in June; western hubs keep adding faster than the country
- Token use is soaring, but work goes to the fastest racks, and domestic services still run at about 69% of foreign speed
- Chipmakers and builders get paid at install; power sellers and hall owners on use; stuck step: the paying hour
FAQ
How much AI computing power does China have?
China's industry ministry said on 20 October 2026 that the country's intelligent computing power reached 2,592 EFLOPS at the end of September, up 146% from a year earlier. At the end of June the figure was 2,185 EFLOPS, so about 407 EFLOPS were added in the third quarter, by our arithmetic. The count measures installed capacity, not how busy it is.
Why is China's data centre power use growing more slowly than its compute?
Power used by internet data services rose 35.4% in September and 41.6% in the first nine months, according to the National Energy Administration. Three things explain most of the gap: newer chips do more sums per unit of power, the power category does not cover every data centre, and some installed capacity is not yet busy. In June about 29% of built rack space had no equipment in it.
Is this investment advice?
No. Education only. It maps who gets paid and which step is stuck. It is not a recommendation to buy or sell any security, and we leave out share prices, broker ratings and price targets on purpose.
Keep reading on the map
- China Markets hub — country page
- Ascend 950DT pool · Hygon and HBM · 8-inch power foundry — recent China Pulses
- CXMT server memory · China September prices · Cambricon third quarter
- Malaysia unused power · NEXTDC billing date · Keppel DC REIT quarter — the hall side elsewhere in Asia
- Power but no tenant · Racks waiting for power
- Where AI data centers are located · Tokens vs GPU hours · Reserved vs on-demand GPUs
- If signed leases wait on handover · Where does the stuck step move?
- AI Data Centers on the stack · Semiconductors · Data center financing
- All Markets doors — Taiwan, Korea, US, China, Singapore, Australia, Malaysia
How we check this. The national compute count comes from China’s industry ministry, as reported by Xinhua and Science and Technology Daily from the State Council Information Office briefing of 20 October 2026, and from the ministry’s end-June figures as reported by People’s Daily. Power use comes from the National Energy Administration’s own monthly releases of 21 October and 20 September. Hub figures for Qingyang and Ulanqab come from local reports carried by Xinhua and the energy administration on 23 and 24 October. Token use and model speed come from the CAICT report of 23 October as reported; chip shipments come from IDC as reported on 13 October. Local and national compute counts may not use the same yardstick, and we say so where it matters. Every sum we worked out is labelled “our arithmetic”. Share prices, broker ratings and price targets are left out on purpose. The references we used are listed at the end. Our editorial standards →
Not investment advice. Do your own research.
References
- Xinhua via the Chinese government portal, China's intelligent computing power reaches 2,592 EFLOPS, 20 Oct 2026. gov.cn — end-September compute count and 146% growth, said by MIIT at the State Council Information Office briefing.
- Science and Technology Daily via Xinhua, Q1-Q3 data show industrial economy steady, 21 Oct 2026. news.cn — the same briefing: compute expansion, the compute marketplace plan, 5G base stations.
- National Energy Administration, January-September electricity consumption, 21 Oct 2026. nea.gov.cn — internet data services power use in September and the first nine months.
- National Energy Administration, August electricity consumption, 20 Sep 2026. nea.gov.cn — internet data services power use in August and the first eight months.
- People's Daily via the Chinese government portal, compute up 177% at end-June, 26 Jul 2026. gov.cn — end-June compute count and the 71.4% national rack fill rate.
- Gansu Daily via Xinhua Gansu, Qingyang data centre cluster passes 300,000P, 24 Oct 2026. gs.xinhua.org — Qingyang compute, growth since end-2025, daily token calls, RMB5 billion fund.
- Science and Technology Daily via the National Energy Administration, Ulanqab green compute, 23 Oct 2026. nea.gov.cn — Ulanqab compute, signed projects and racks, power price, latency to Beijing, new campus plans.
- Guandian, CAICT and AIIA large-model token service monitoring report (2026), 23 Oct 2026. guandian.cn — daily token use in June, speed of domestic and foreign models.
- Commercial Times (CTEE), IDC: Nvidia's China AI chip share falls to 34%, Huawei 28%, 13 Oct 2026. ctee.com.tw — IDC first-half 2026 accelerator shipments by vendor and type.


