
RM45 Billion Out, RM42 Billion In: Who Gets Paid in Malaysia's Chip Export Record
Malaysia shipped a record RM110.2 billion of electronics in September, up RM45.1 billion on a year earlier. Electronics imports rose RM42.2 billion. Most of the extra money passed through to the chip and memory makers abroad. The slice Malaysia keeps grows only as fast as its own lines can.

Malaysia had its biggest export month on record in September. Electronics did most of the work: RM110.2 billion shipped, RM45.1 billion more than a year earlier. But look at the other side of the ledger. Electronics imports rose by RM42.2 billion in the same month. Most of the extra money went straight back out, to the people who make the chips and memory that Malaysia tests, packs and builds into machines. The slice that stays is real and growing, but it grows only as fast as Malaysia's own lines can. The stuck step is installed, qualified capacity.
MALAYSIA PULSE · SEMICONDUCTORS · Data as at 23 Oct 2026 · Next update: DOSM's detailed September trade report, 28 Oct
Affects: Semiconductors · Hyperscalers · AI Data Centers — Markets: Malaysia · Taiwan · Korea · Singapore · US
Education only, not advice to buy or sell any security. Figures are as published by Malaysia's statistics department and trade ministry or as reported by the publications named. September data are provisional. Our own sums are labelled.
The numbers that matter this week
E&E exports, September
RM110.2bn
+69.2% · +RM45.1bn on a year ago · record
RecordE&E imports, September
RM87.9bn
+92.3% · +RM42.2bn on a year ago
Passed throughE&E gap kept, September
+RM2.9bn
RM19.4bn a year ago → RM22.3bn (our arithmetic)
Thin sliceExtra exports matched by imports
~95% in Q3
~56% in the first half (our arithmetic)
ShiftReal manufacturing growth, Q3
7.5%
Advance GDP estimate · E&E-led
VolumeTool lead times, Penang and Johor
6–12 months
Kenanga site visits · 2 Oct
ClockFigures from the DOSM and MITI releases of 19 October 2026, the DOSM advance GDP estimate of 16 October 2026 and Kenanga Research of 2 October 2026. Gap and share figures are our arithmetic. Status chips are Second Order’s read.
On this page: Why it matters · What the data said · The gap · The quarter · Where it went · Value versus volume · The lines · At home · Our math · Who gets paid · What is stuck? · Dates next · What would change this · FAQ
Why does a trade record matter to who gets paid in AI hardware?
Because a trade record counts the full price of every box that leaves the country, not the part of the price that was earned there. When an AI server or a tested chip package leaves Penang, its export value includes the processor, the memory stacks and the circuit boards inside it. Many of those parts were made somewhere else and bought in. The export figure goes up by the whole price. The money Malaysia earns is the work it added on top.
That is why the import side of the same release matters as much as the headline. If exports rise by a large amount and imports of the same kind of goods rise by almost as much, the record is mostly the price of other countries' chips passing through Malaysian factories. That is still good business. Malaysian plants are busy, workers are paid, and the country is part of the AI hardware chain. But it tells you who collects most of the extra money, and it tells you what limits Malaysia's own share.
We have written four Malaysia pieces this month, all about power for data centres: how much of the connected power is used (10 October), DayOne's financing (13 October), the charge on booked but unused power (17 October) and the green-power grid charge (18 October). This one is about the other half of Malaysia's AI story: the chips and machines it makes for the rest of the world.
1 · The parts
Who: Processors, memory, boards bought in
Paid: Mostly made in Taiwan, Korea, China and elsewhere
2 · The work
Who: Assembly, packaging, test, server build in Malaysia
Paid: Real output up 7.5% in Q3
3 · Qualified capacity binds
Who: Lines, tools and people ready to ship
Paid: Tool lead times 6–12 months; orders ahead of supply
4 · The buyer
Who: Server makers and cloud builders in the US, Taiwan, Singapore
Paid: US exports up 89.9% in September
What did the September data say?
The Department of Statistics Malaysia and the trade ministry published September trade on 19 October. Almost every line was a record.
- Total exports. RM215.1 billion, up 54.5% on September 2025, the fastest growth since April 2021 and the first month above RM200 billion. A Bloomberg survey had expected 39.9%.
- Electronics exports. E&E products were RM110.2 billion, up 69.2% or RM45.1 billion, a monthly record and 51.2% of all exports. E&E alone supplied about 59% of the RM75.9 billion rise in total exports (our arithmetic).
- Electronics imports. E&E imports were RM87.9 billion, up 92.3% or RM42.2 billion, and 48.5% of all imports.
- Imports by use. Intermediate goods, the parts that go into products made here, rose 69.6% to RM92.1 billion, which the ministry put down to more parts and accessories for capital goods. Capital goods rose 20.9% to RM22.3 billion.
- Surplus. The trade surplus was RM33.7 billion, the 77th surplus month in a row.
- Test gear too. Optical and scientific equipment, a group that includes semiconductor test instruments, also hit a monthly record at RM8.1 billion, up 43.2%.
Research houses read it the same way. HLIB Research, as reported by The Star on 21 October, said semiconductor-related exports grew 107.5% in September after 117.1% in August. UOB Kay Hian pointed to World Semiconductor Trade Statistics forecasts that global chip sales rise 90% to US$1.5 trillion this year. Apex Research raised its 2026 export forecast to 35.1%. The Ministry of Finance projects export growth of 31% for the year.
How much of the extra money did Malaysia keep?
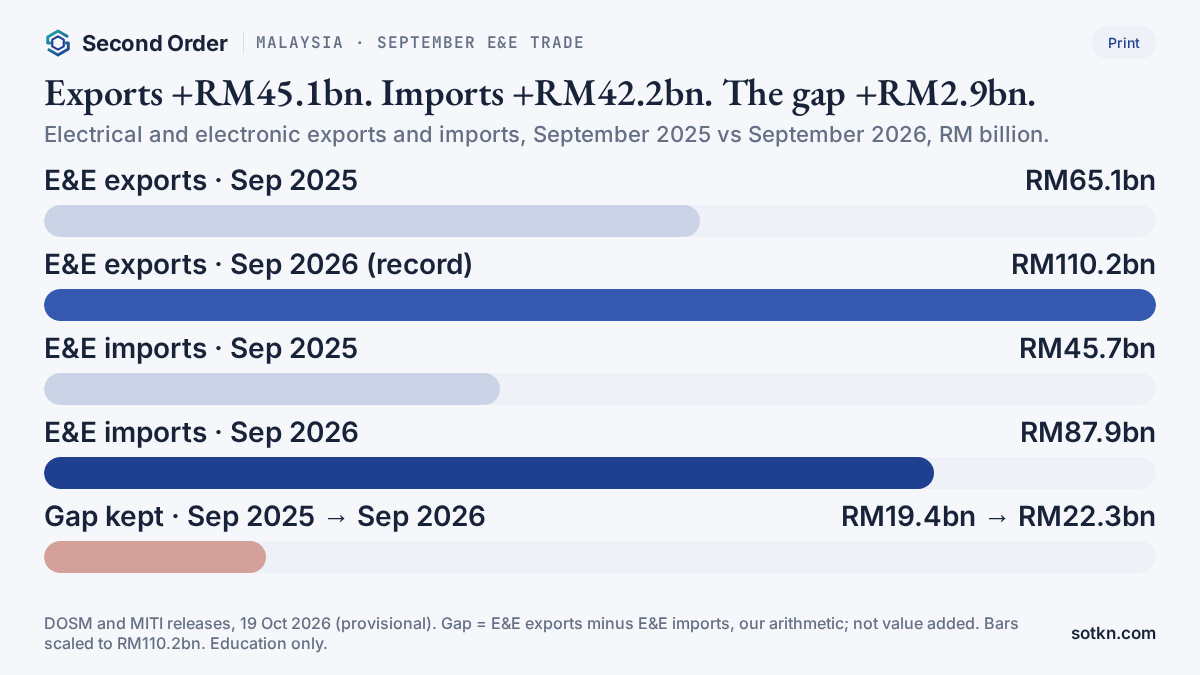
Take E&E exports and subtract E&E imports. The result is not value added; we explain why below. But it is a rough guide to how much of the electronics money stays in the country rather than paying for parts from abroad.
In September 2025, Malaysia exported RM65.1 billion of electronics and imported RM45.7 billion. The gap was RM19.4 billion. In September 2026 it exported RM110.2 billion and imported RM87.9 billion. The gap was RM22.3 billion. Exports grew by RM45.1 billion. The gap grew by RM2.9 billion. For every extra ringgit of electronics exported, about 94 sen was matched by an extra ringgit's worth of electronics coming in (our arithmetic).
Put another way: a year ago the gap was about 30% of E&E exports. This September it was about 20%. The business got much bigger and much thinner at the same time. That is what happens when the most expensive parts of the product are made elsewhere and their prices are rising fast.
And their prices are rising fast. The parts at the centre of AI hardware are processors built in Taiwan and high-bandwidth memory, the stacked memory that sits beside AI chips, made mainly in Korea. Our HBM explainer covers why that memory is scarce. When the parts inside a box cost more, the export price of the box goes up even if the Malaysian work on it is the same.
Did something change in the third quarter?
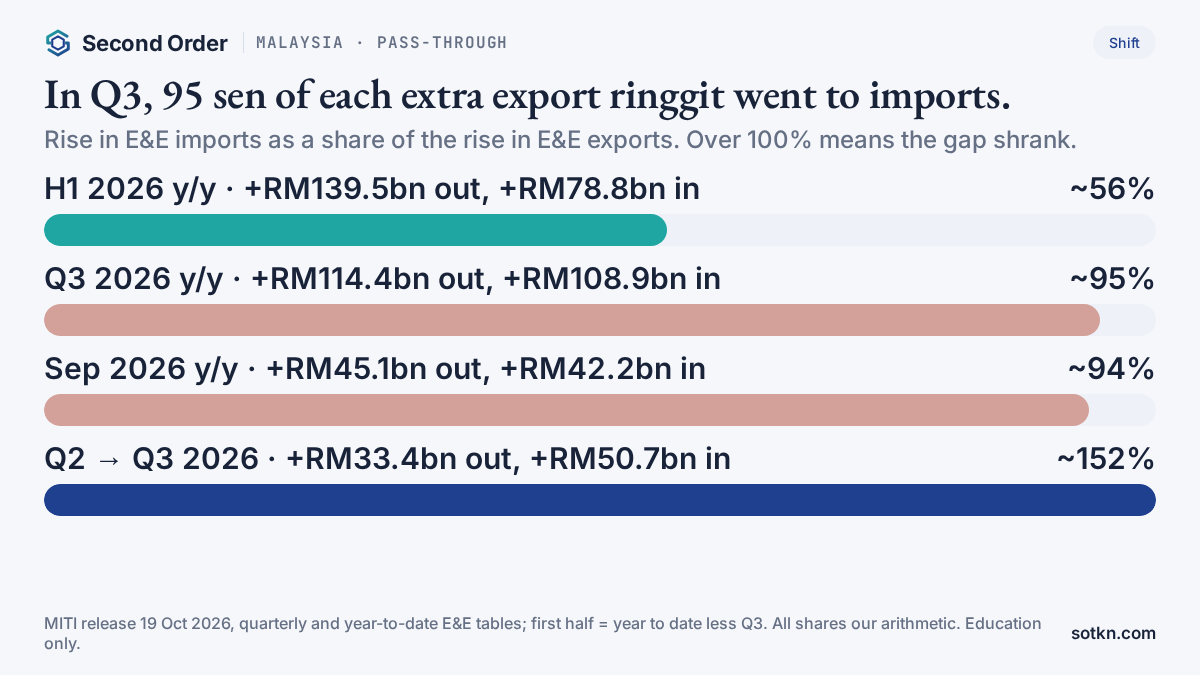
Yes, and this is the part of the release that changes the story. September was not a one-off. The whole quarter looks like it.
In the first half of 2026, E&E exports were about RM139.5 billion higher than in the first half of 2025, and E&E imports were about RM78.8 billion higher. Only about 56% of the extra export value was matched by extra imports. The electronics gap doubled, from about RM58.8 billion to about RM119.5 billion. Malaysia was keeping a big share of the boom (our arithmetic).
In the third quarter, E&E exports were RM298.4 billion, up 62.1% or RM114.4 billion on a year earlier. E&E imports were RM246.0 billion, up 79.4% or RM108.9 billion. About 95% of the extra export value was matched by extra imports. The gap rose only from RM46.8 billion to RM52.3 billion (our arithmetic).
Against the second quarter it is starker. E&E exports rose RM33.4 billion from the second quarter to the third. E&E imports rose RM50.7 billion. The electronics gap fell from about RM69.7 billion in the second quarter to about RM52.3 billion in the third (our arithmetic). Malaysia shipped more electronics than ever, and kept less of the electronics money than three months earlier.
There are two ways to read that. One is that the mix shifted toward products where the parts are a bigger share of the price: AI servers and boards stuffed with costly processors and memory, rather than older chips that Malaysia tests and packs for a bigger share of their value. The other is timing: factories bought parts in the third quarter that will leave as finished goods in the fourth. Apex Research, as reported by The Star, read the strong intermediate imports as a sign of a firm order book. Both can be true. The October figures will help tell them apart.
Where did the goods go, and where did the parts come from?
The partner tables line up with the hardware chain. The ministry does not split E&E by partner, so what each flow contains is our read, not the release's.
- United States. Exports to the US were RM38.0 billion in September, up 89.9% or RM18.0 billion, the biggest single rise. In the third quarter they were RM108.7 billion, up 98.5%. The ministry credited E&E. This is where the cloud builders are.
- Taiwan. Exports to Taiwan more than doubled, up 175.2% to RM21.5 billion, the highest ever, on E&E, LNG and optical and scientific equipment. Imports from Taiwan rose 55.6% to RM19.3 billion. A year ago Malaysia ran a deficit of about RM4.6 billion with Taiwan in September; this year a surplus of about RM2.2 billion (our arithmetic).
- Singapore. Exports to Singapore rose RM11.9 billion to RM35.5 billion, a record, credited to E&E. Imports from Singapore rose 90.7% to RM22.9 billion.
- Korea. Imports from Korea rose 205.7% to RM13.5 billion, an extra RM9.1 billion in a month. In the third quarter they were up 133.3%. The release does not say what they were. Korea is home to SK hynix and Samsung, two of the three makers of high-bandwidth memory, so memory is the obvious guess, but it is a guess.
- China. Imports from China rose 67.6% to RM52.3 billion, the largest import rise at RM21.1 billion. Exports to China rose a slower 22.1%.
Read across the three Asian Markets doors and the pattern is the same chain from three angles. Taiwan's own September exports were a record as servers outsold chips (Taiwan exports Pulse). Korea's chip invoices are the memory end of the same orders (Korea ICT Pulse and Korea daily chips Pulse). Malaysia sits between them, taking in parts from both and shipping out tested packages and machines.
If the money mostly passes through, is the boom real for Malaysia?
Yes, in volume. The advance estimate of third-quarter GDP, published on 16 October, put growth at 5.3% and manufacturing growth at 7.5%, up from 7.3% in the second quarter. The statistics department said the stronger performance was led by export-oriented industries, especially electrical, electronic and optical products.
Set that next to the trade numbers. E&E export value rose 62.1% in the third quarter. Manufacturing output, measured after stripping out price changes, rose 7.5%. Those are not the same measure, so the gap between them is not a precise number. But the direction is clear. Most of the jump in the export figure is price and parts, not a jump in how much work Malaysian factories did. Malaysian factories did more work, about as much more as a strong year normally brings. The value of what passed through their doors exploded.
That matters for who gets paid. A Malaysian packaging and test house is paid for the work it does on each unit, not a share of the processor's price. A server assembler earns a margin on the build, while the processor and memory inside are paid for at their makers' prices. When the parts get dearer, the export figure rises a lot and the Malaysian fee rises a little. When the number of units rises, the Malaysian fee rises properly.
That is also why a big export figure can come with a cash squeeze for the builder. A server maker has to buy the costly parts before it is paid for the finished machine. Our members' Wiwynn Analysis showed a Taiwanese server maker whose sales doubled while cash went out for exactly that reason.
What limits how much more work Malaysian lines can do?
Capacity, on the ground. Kenanga Research published notes from site visits in Penang and Johor on 2 October, covering equipment makers, precision engineering and machining houses, listed and unlisted. Its findings line up with what the trade data imply.
- Orders are ahead of supply. The companies it met expected order books to grow 20% to 40% quarter on quarter. The question had moved from whether orders would come to how fast capacity could be added.
- Capacity is the limit. Kenanga wrote that the near-term limit is how much companies can produce rather than how much customers want to order, putting a premium on capacity that is installed, qualified and ready to ship. Even subcontractors were seeing capacity tighten.
- Tools take time. Equipment lead times have stretched to 6 to 12 months. Once a machine arrives, customers push for it to be running within a month, but getting it is the hard part.
- Materials too. ViTrox, the Penang inspection-equipment maker, told Kenanga the cycle is unprecedented in its management's experience and that deliveries could have been considerably higher without material and supply-chain bottlenecks.
- 2027 is the ramp. Much of the work on the order books has not yet turned into sales. New lines, qualifications and customer programmes are expected to contribute more from 2027.
That is the stuck step for Malaysia's share. The parts makers abroad are paid when the order is placed. Malaysia's fee grows only as new lines are installed and qualified by customers, and qualification is slow because a customer will not move a costly AI product onto a line until it has proved it can yield. Inspection is part of that gate; our members' KLA inspection Analysis follows the same logic at the tool end.
Does Malaysia use any of this hardware itself?
Some, and more is planned, which complicates the import figures. A GPU server installed in a Johor data hall is an import that does not leave again. The capital goods line, where such equipment tends to sit, rose 20.9% in September, far slower than the 69.6% rise in intermediate goods. So most of the import surge looks like parts for products that will be exported, not machines for Malaysian halls. That is our read of the end-use split, not something the release states.
The home market is growing, though. On 19 October Aolani, a Singapore-founded neocloud, said it had signed non-binding letters of intent to take up 500 MW of AI data centre capacity across several Malaysian sites, coming online from the second half of 2027, on top of about 80 MW committed this year. It did not name the landlord, and the letters still need definitive agreements. If that kind of demand turns into installed GPUs, more of Malaysia's electronics imports will stay in the country, and the power questions in our earlier pieces come back into play. For what a neocloud is and how it pays for GPUs, see who the neoclouds are and GPU financing explained.
Our math: what do the numbers say?
- September E&E gap: RM65.1 billion minus RM45.7 billion is RM19.4 billion a year ago; RM110.2 billion minus RM87.9 billion is RM22.3 billion now; up about RM2.9 billion (our arithmetic).
- Pass-through in September: the RM42.2 billion rise in E&E imports is about 94% of the RM45.1 billion rise in E&E exports (our arithmetic).
- Gap as a share of E&E exports: about 30% in September 2025, about 20% in September 2026 (our arithmetic).
- Third quarter: E&E exports up RM114.4 billion and imports up RM108.9 billion, so about 95% matched; the gap rose from RM46.8 billion to RM52.3 billion (our arithmetic).
- First half: E&E exports up about RM139.5 billion and imports up about RM78.8 billion, so about 56% matched; the gap rose from about RM58.8 billion to about RM119.5 billion (our arithmetic from year-to-date less third-quarter figures).
- Quarter on quarter: from the second quarter to the third, E&E exports rose RM33.4 billion and imports rose RM50.7 billion; the rise in imports was about 152% of the rise in exports, so the gap fell from about RM69.7 billion to about RM52.3 billion (our arithmetic).
- Taiwan: a September deficit of about RM4.6 billion a year ago turned into a surplus of about RM2.2 billion (our arithmetic).
- Value against volume: E&E export value up 62.1% in the third quarter against real manufacturing growth of 7.5%. Different measures, so this is a direction, not a ratio.
What this tells you: Malaysia's AI export boom is real in volume and enormous in value, but the value is mostly other countries' chips and memory passing through. In the third quarter the share passing through jumped. What decides how much Malaysia keeps is not demand, which is plentiful, but how many qualified lines it can add.
Who gets paid first?

First, the chip and memory makers abroad — at the order, at full price. The processors and memory inside an AI server are bought before the server is built. The RM42.2 billion rise in E&E imports in September is mostly their bill. For where the processor bottleneck sits now, see our TSMC CoWoS Pulse.
Second, the tool and materials suppliers — now, at the order. Every Malaysian line that is added needs machines with 6 to 12 month lead times, and inspection and test gear. Local equipment makers and precision engineering houses are paid as lines are built, before the new line earns its first fee.
Third, Malaysian assembly, packaging and test lines — on volume. They are paid per unit of work. Real manufacturing growth of 7.5% is roughly their pace. Their fee grows as fast as qualified capacity does, not as fast as the export figure.
Fourth, Malaysian workers, landlords and the state — on the slice. Wages, factory space and taxes are paid out of the value added here, the thin part of the record.
Last, the cloud builders who buy the finished machines — they pay the full price. US exports rose RM18.0 billion in September. The money comes from the capital budgets of the big cloud companies; our Meta capex Pulse shows how fast that spending is running and how far ahead of cash it now is.
One-line rule: in Malaysia's export record, the parts makers abroad are paid first and in full, the toolmakers are paid as lines are built, and Malaysia's own lines are paid per unit. The stuck step is installed, qualified capacity.
So what is the stuck step?
Installed, qualified capacity: Malaysian lines that are built, tooled, staffed and approved by the customer to run AI products. Not demand: order books are growing faster than supply, by every account we have. Not the parts: they are scarce and dear, but that is the parts makers' bind, and it makes Malaysia's slice look thinner rather than smaller. The capacity is what decides how big Malaysia's own share can get, and three things make it stick:
- Tools arrive slowly. Lead times of 6 to 12 months for new equipment, on Kenanga's visits, put a floor under how fast a new line can start.
- Customers qualify slowly. A line has to prove it can yield before a customer moves a costly AI product onto it. That is why so much of today's order book only turns into sales in 2027.
- The mix works against the share. The more AI hardware is made of costly imported processors and memory, the more export value passes through for each unit of Malaysian work. The third quarter showed that effect getting stronger.
This is the pattern in our stuck-step Analysis: whoever owns the scarce step is paid first, and whoever waits on it is paid on its schedule. For Malaysia, the scarce steps today are mostly abroad. The one at home is the line.
Which dates test this read next?

- 28 October 2026 — DOSM's detailed monthly trade report for September, with fuller product breakdowns than the headline release.
- October trade data — The next monthly release. If the parts bought in the third quarter leave as finished goods, E&E exports should rise faster than E&E imports and the gap should widen.
- Section 301 outcome — The US trade representative opened its excess-capacity investigation, which includes Malaysia, on 11 March and held hearings from 5 to 8 May. No decision has been published. Apex Research and UOB Kay Hian both flag US tariffs as a risk.
- 2027 — The ramp year in Kenanga's visits, when new lines and programmes are expected to turn into sales. UOB Kay Hian forecasts export growth of only 3.5% in 2027 as the high base sets in.
- Second half of 2027 — Aolani's targeted start for the first of its 500 MW in Malaysia, if the letters of intent become contracts.
What would change this view?
- A wider E&E gap in October and November, as third-quarter parts leave as finished goods, would show the quarter's pass-through was partly timing and that Malaysia's slice is wider than it looked.
- Product detail in the 28 October report showing the import surge in categories Malaysia transforms heavily, rather than finished processors and memory, would weaken the pass-through read.
- Faster tool deliveries or quicker customer qualifications, visible in company results, would ease the capacity bind and lift Malaysia's share sooner than 2027.
- A US tariff decision on semiconductors or on Malaysian goods would move the bind from capacity to market access.
- A turn in AI spending by the cloud builders would move the bind to demand, and the pass-through would shrink from the top.
Practical takeaways
- September E&E exports rose RM45.1 billion to a record RM110.2 billion; E&E imports rose RM42.2 billion
- The electronics gap Malaysia keeps grew only about RM2.9 billion (our arithmetic)
- In the third quarter about 95% of the extra E&E export value was matched by extra imports, against about 56% in the first half
- Real manufacturing grew 7.5%: the boom is real in volume, enormous in value
- Parts makers abroad are paid first; Malaysian lines are paid per unit; stuck step: installed, qualified capacity
FAQ
How much did Malaysia's electronics exports grow in September 2026?
Exports of electrical and electronic (E&E) products were RM110.2 billion in September 2026, up 69.2% or RM45.1 billion on September 2025, and a monthly record. They made up 51.2% of all exports. Total exports were RM215.1 billion, up 54.5%, the first month above RM200 billion.
If exports rose so much, why do you say Malaysia kept only a thin slice?
Because electronics imports rose almost as much. E&E imports were RM87.9 billion, up RM42.2 billion. The gap between E&E exports and imports, a rough guide to what stays in the country, grew by only about RM2.9 billion. In the third quarter, about 95% of the extra E&E export value was matched by extra E&E imports, against about 56% in the first half. That is our arithmetic on official figures, and a trade gap is not the same as value added.
Is this investment advice?
No. Education only. It maps who gets paid and which step is stuck. It is not a recommendation to buy or sell any security, and we leave out share prices, broker ratings and price targets on purpose.
Keep reading on the map
- Malaysia Markets hub — country page
- Malaysia power use · DayOne financing · Unused-power charge · Green-power grid charge
- Taiwan September exports · Foxconn AI racks · TSMC CoWoS
- Korea ICT surplus · Korea daily chips
- Meta capex Pulse — the buyer's side
- Wiwynn working-capital Analysis · KLA inspection Analysis
- Semiconductors on the stack · HBM explained · Chiplets explained · Sovereign AI explained
- All Markets doors — Taiwan, Korea, US, China, Singapore, Australia, Malaysia
How we check this. Monthly and year-to-date trade figures come from the Department of Statistics Malaysia media release of 19 October 2026; quarterly, partner and year-to-date product tables come from the Ministry of Investment, Trade and Industry release of the same day. Third-quarter GDP and manufacturing growth come from the Department of Statistics advance estimate of 16 October 2026. Research-house comments are as reported by The Star on 21 October (HLIB, UOB Kay Hian, Apex, TA) and as published by Kenanga Research on 2 October. The survey median is as reported by Bloomberg via The Edge Malaysia on 19 October. Aolani’s plans are from its own release of 19 October. September figures are provisional and the official releases do not split E&E trade by product or by partner, so where we say what a number probably contains, we say it is our read. Anything we worked out ourselves is labelled “our arithmetic”. Share prices, broker ratings and price targets are left out on purpose. The references we used are listed at the end. Our editorial standards →
Not investment advice. Do your own research.
References
- Department of Statistics Malaysia, Malaysia External Trade Statistics, September 2026 (media release), 19 Oct 2026. dosm.gov.my — September exports, imports and surplus; E&E exports and imports by value and growth; export and import changes by partner; imports by end use; the detailed monthly report due 28 October.
- Ministry of Investment, Trade and Industry, Trade Performance: January to September 2026 and September 2026, 19 Oct 2026. miti.gov.my — partner tables for September, the third quarter and January to September; E&E exports and imports by quarter and year to date; Ministry of Finance 2026 trade projections.
- Department of Statistics Malaysia, Advance GDP Estimates, Third Quarter 2026, 16 Oct 2026. dosm.gov.my — GDP growth of 5.3% and manufacturing growth of 7.5% in the third quarter, led by electrical, electronic and optical products.
- The Star, Tech, energy demand to fuel 2026 export boom, 21 Oct 2026. thestar.com.my — HLIB Research on semiconductor-related exports; UOB Kay Hian Research on the 2027 export outlook and risks; Apex Research on the Section 301 investigation and intermediate imports; TA Research on forecasts.
- The Edge Malaysia (Bloomberg), Malaysia's exports hit five-year high in September as electronics shipments jump, 19 Oct 2026. theedgemalaysia.com — the Bloomberg survey median of 39.9% export growth; record E&E month; optical and scientific equipment, including semiconductor test instruments, at a record.
- Kenanga Research, Technology: Key Takeaways from Our Recent Tech Visits, 2 Oct 2026. kenanga.com.my — order books expected to grow 20% to 40% quarter on quarter; capacity as the limit; equipment lead times of 6 to 12 months; ViTrox on material bottlenecks; 2027 as the ramp year.
- Aolani, Aolani Signs Letters of Intent for Up to 500MW of AI Data Centre Capacity in Malaysia, 19 Oct 2026. aolani.com — non-binding letters of intent for 500 MW from the second half of 2027; about 80 MW already committed in 2026.
- Office of the United States Trade Representative, USTR initiates Section 301 investigations relating to structural excess capacity and production in manufacturing sectors, 11 Mar 2026. ustr.gov — the investigation that includes Malaysia; public hearings held 5 to 8 May 2026.