CoreWeave vs Nebius: How the Two Biggest Neoclouds Get Paid, Compared
CoreWeave and Nebius both sell GPU computing time. CoreWeave is about 3.7 times bigger by revenue, with US$132.3 billion of backlog and US$46.9 billion of debt. Nebius is smaller and growing faster, and its customers now prepay more of the build. Both wait on the same thing: power at the hall.
EXPLAINED · Versus · Last reviewed: 22 Nov 2026 · Next review: when CoreWeave and Nebius report their fourth-quarter 2026 results
CoreWeave vs Nebius compares the two largest listed neoclouds: both sell GPU computing time to AI labs and big companies, but they pay for their data centers in different ways.
In short. What is the difference between CoreWeave and Nebius? Both sell GPU computing time to AI labs and big companies. CoreWeave is about 3.7 times bigger by quarterly revenue and holds US$132.3 billion of signed work. It pays for its build mostly with debt and leased halls. Nebius is smaller and growing faster. Its customers now prepay more of the build, and it plans to own most of its new sites. Our read: the product is the same. The money behind it is not. And both are waiting on the same stuck step: power at the hall.
Why an investor cares: these are the two largest listed neoclouds, and they show two different ways to fund the same AI build. This page sits in our Neoclouds layer. Our neocloud explained page covers what a neocloud is. This page puts the two biggest side by side, using their September 2026 quarter filings.
What is the difference between CoreWeave and Nebius? The short answer
They sell the same thing. Both buy Nvidia GPUs, put them in data centers, and sell the computing time to AI labs and large companies. Most of the money comes from contracts that run for years.
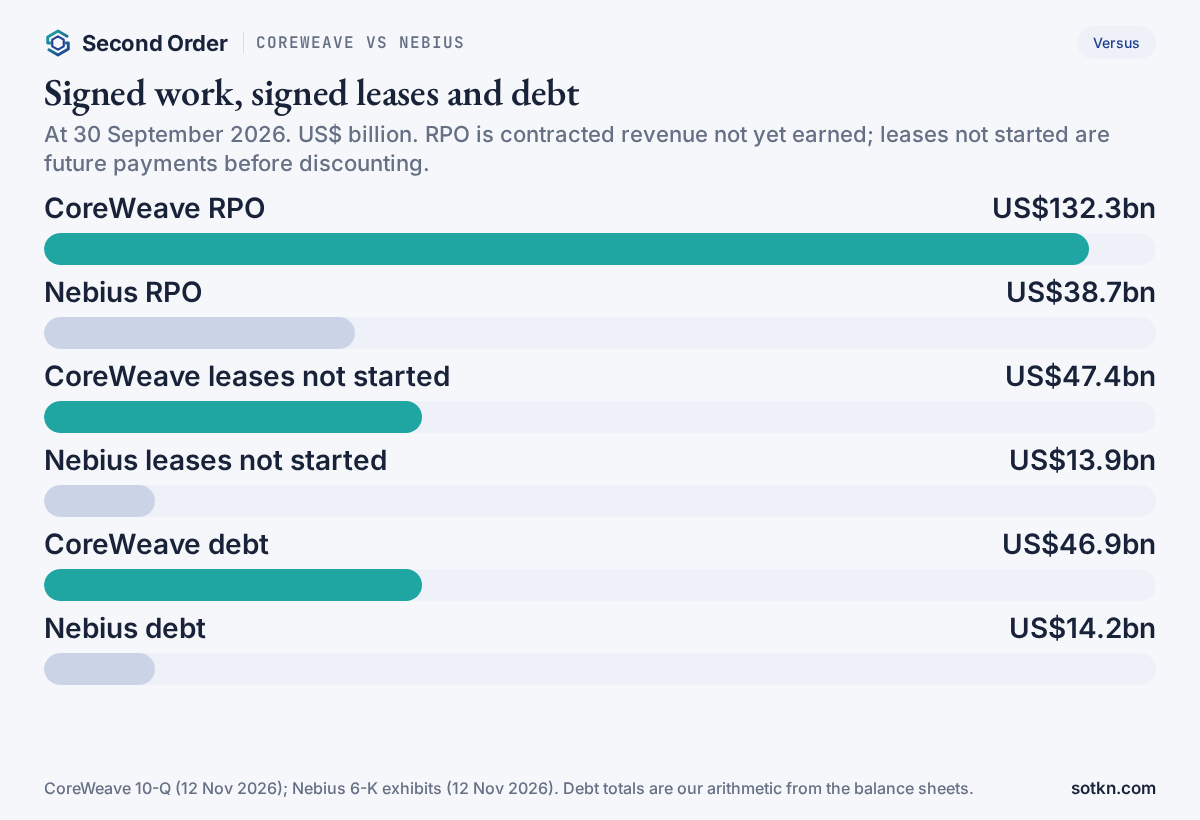
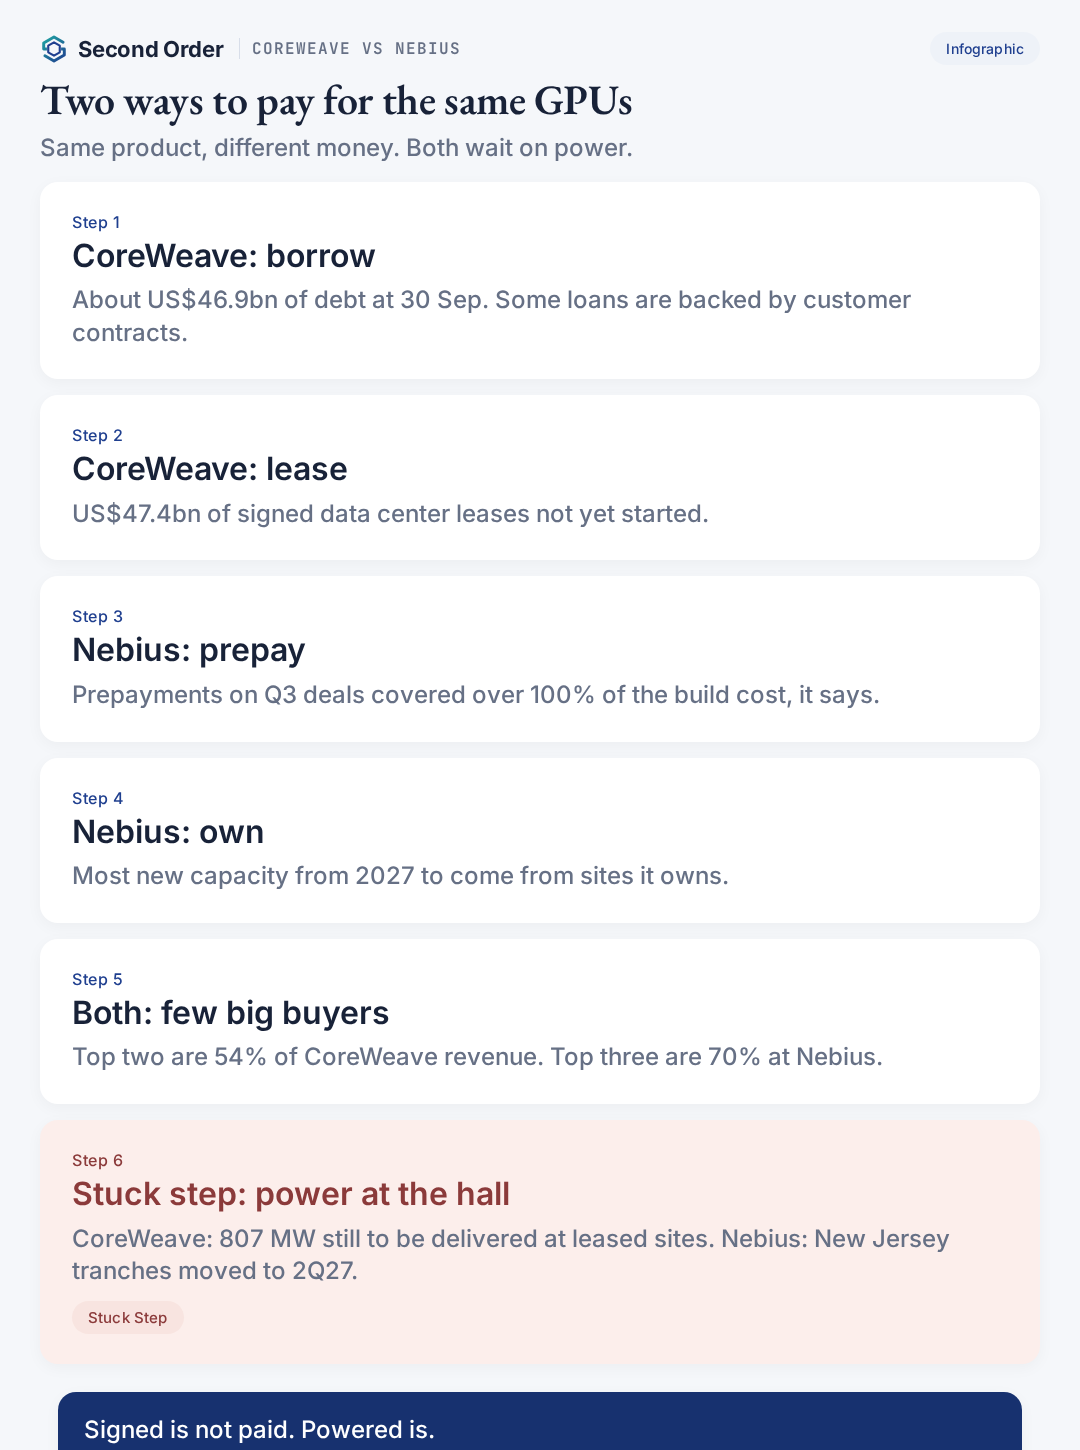
The difference is how each pays for it. CoreWeave borrows. At 30 September 2026 it carried about US$46.9 billion of debt, by our arithmetic from its balance sheet, against US$4.0 billion of equity. It mostly leases its data centers from other owners.
Nebius asks its customers to pay first. It says prepayments on deals signed in the September quarter covered more than 100% of the related build cost. It also raised money by selling shares and convertible notes, and it plans to own most of its new sites.
Size is the other gap. CoreWeave’s revenue for the quarter was US$3,661 million. Nebius’s was US$980.8 million. That makes CoreWeave about 3.7 times bigger, by our arithmetic. But Nebius is growing faster from a smaller base.
CoreWeave vs Nebius side by side
| Measure (quarter to 30 Sep 2026) | CoreWeave | Nebius |
|---|---|---|
| Revenue, quarter | US$3,661m, up 168% on a year ago | US$980.8m, up 571% on a year ago |
| Adjusted EBITDA margin | 62% | 47.5% group; 53% for the AI cloud |
| Net result, quarter | Loss of US$709m | Loss of US$37.5m (continuing operations) |
| Signed work not yet earned (RPO) | US$132.3bn; 36% within 24 months | US$38.7bn; 40% within 24 months |
| Largest customers, share of revenue | Two: 30% and 24% | Three: 33%, 22% and 15% |
| Power | Over 1.7 GW active; over 4.6 GW contracted | Over 4 GW contracted; aims for 5 GW by end-2026 |
| Debt | About US$46.9bn | About US$14.2bn |
| Equity | US$4.0bn | US$12.3bn |
| Signed leases not yet started | US$47.4bn | US$13.9bn |
| How it mainly funds the build | Debt backed by contracts, plus leases | Customer prepayments, convertible notes and share sales |
From CoreWeave’s third-quarter release and 10-Q, and Nebius’s third-quarter release, shareholder letter and financial statements, all filed in November 2026. Percentages, debt totals and margins not stated directly are our arithmetic.
Read the table as two answers to one question: who carries the risk while the halls are being built? At CoreWeave, lenders and landlords carry much of it. At Nebius, customers carry more of it up front.
How big is each one?
CoreWeave is the larger business on every reported measure. In the September 2026 quarter its revenue rose about 168% from a year earlier, by our arithmetic. Its chief executive said revenue grew by more than US$1 billion from the June quarter. It now expects 2026 revenue of US$13.0 billion to US$13.3 billion.
Nebius grew faster. Its revenue rose about 571% from a year earlier, to US$980.8 million. Almost all of that, US$973.8 million, came from its AI cloud. Nebius now expects 2026 revenue at the low end of its US$3.0 billion to US$3.4 billion range, because some revenue moved into early 2027. For 2027 it gives a first outlook of US$12 billion to US$13 billion.
One detail matters when comparing growth. Of Nebius’s AI cloud revenue in the quarter, US$325.1 million, about a third, came from what it calls strategic partnerships. Nebius says these are non-recurring by nature and hard to predict. Without them, AI cloud revenue was about US$648.7 million, by our arithmetic.
Our ARR explained page covers why one strong quarter can flatter a run-rate figure. CoreWeave now guides to US$20 billion to US$21 billion of annualized run-rate revenue at the end of 2026, which it calculates from the last month of the quarter times twelve.
How does each one get paid?
Both mostly sell long contracts. A customer reserves a block of GPUs for one to five years, at an agreed price per GPU-hour or per megawatt. For reserved capacity, the customer usually pays whether or not it uses every hour.
CoreWeave is almost all contract. Its 10-Q says revenue from customer commitments was 98% of total revenue in the September quarter. Its biggest deals are very large. The filing says Meta committed to pay up to about US$21.0 billion under an order form signed in March 2026, and Jane Street about US$6.0 billion, announced in April 2026.
Nebius sells more ways. It offers on-demand hours, reserved capacity, and since this quarter, reserve auctions and live spot prices. It also runs a managed inference service it calls Token Factory, which it says is approaching a run rate of several hundred million dollars. Most of its revenue still comes from reserved contracts of one to three years, and it has started signing five-year deals.
Prices moved up at Nebius. It says annual contract value per megawatt was more than US$25 million on deals signed in the quarter, up from more than US$20 million on June-quarter deals. It also says prices per GPU-hour rose more than 20% on average against the June quarter.
For the pricing basics, see our reserved vs on-demand GPU and GPU price explained pages.
How much work has each signed?
The cleanest measure is remaining performance obligations, or RPO. It is contracted revenue the company has not yet earned, because it has not yet delivered the GPUs.
CoreWeave reported US$132.3 billion of RPO at 30 September 2026. It expects 36% to turn into revenue within 24 months, which is about US$47.6 billion, by our arithmetic. Another 38% falls in months 25 to 48, and the rest out to month 86. Its results release gives a slightly wider figure, revenue backlog of about US$132.5 billion.
Nebius reported US$38.7 billion of RPO at the same date. It expects 40% within 24 months, about US$15.5 billion, and another 40% in months 25 to 48. Nebius also says customers signed more than US$12 billion of contract value since the start of the third quarter, some of it after 30 September.
Scaled to size, the two look alike. CoreWeave’s RPO is about 36 times its latest quarterly revenue. Nebius’s is about 39.5 times, by our arithmetic. Both have years of work signed. The question is how fast they can deliver it.
Our RPO explained and revenue backlog vs RPO pages cover why the two backlog figures differ.
Who are the customers?
Both depend on a few very large buyers. That is normal for neoclouds, and it is the biggest single risk in each business.
At CoreWeave, two customers made up 30% and 24% of revenue in the September quarter, 54% together. A year earlier, one customer made up 67%. So CoreWeave has spread out, but two buyers still decide most of its revenue. Its 10-Q names Microsoft, OpenAI and Meta as significant customers, without matching them to the percentages.
At Nebius, three customers made up 33%, 22% and 15% of revenue in the quarter, 70% together. One customer also made up 75% of its accounts receivable at 30 September. Nebius does not name them in that table. Its letter says it has capacity contracted with Microsoft in New Jersey, and that it signed first agreements with Databricks, Datadog, Palantir and Snowflake.
Our read: Nebius is more concentrated today, but the base is widening. Our customer concentration explained page covers how to read these tables.
Who pays for the build?
This is the real difference between the two. GPUs and halls cost far more than a year of revenue. Someone has to put up the cash first.
| Who pays for the build | CoreWeave | Nebius |
|---|---|---|
| Capex, nine months to 30 Sep 2026 | US$23.6bn | US$15.4bn |
| Capex vs revenue, nine months | 2.8 times | 7.9 times |
| Customer cash held in advance (deferred revenue) | US$10.0bn | US$9.4bn |
| Debt vs equity | 11.6 times | 1.15 times |
| Interest vs quarterly revenue | 23.1% (net) | 11.5% |
Balance sheets at 30 September 2026. Ratios are our arithmetic. CoreWeave reports interest expense net of interest income; Nebius reports interest expense net of interest capitalised on construction.
CoreWeave spent US$23.6 billion on property and equipment in the nine months to September, about 2.8 times its revenue for the period, by our arithmetic. It expects US$37 billion to US$39 billion of capex for 2026. Most of the money is borrowed, and part of the debt is backed by customer contracts. Its net interest expense was US$846 million in the September quarter, about 23% of revenue.
Nebius spent US$15.4 billion in the same nine months, about 7.9 times its revenue. It is building ahead of its revenue much harder. But it funds more of it with customer cash. Its deferred revenue, which is mostly cash customers have paid in advance, rose to about US$9.4 billion. That is close to ten times its quarterly revenue, by our arithmetic. CoreWeave’s was about US$10.0 billion, under three times its quarterly revenue.
Nebius also raised equity. In the nine months it took in about US$3.9 billion from selling treasury shares and US$2.0 billion from prefunded warrants, alongside about US$10.1 billion of convertible notes. That is why its debt is lower against its equity. For 2027 it plans capex of US$40 billion to US$45 billion, and expects prepayments and financing against existing contracts with investment-grade customers to cover 75% to 85% of it.
Our prepayment explained page covers how customer cash in advance works, and GPU financing explained covers loans backed by contracts. Our neocloud debt analysis looks at what high borrowing costs do to this model.
Lease or own: where do the halls come from?
CoreWeave mostly leases. At 30 September it had US$47.4 billion of signed leases that had not yet started, mainly for data centers, starting between 2026 and 2029. Its operating lease liabilities on the balance sheet were about US$18.7 billion. On top of that, one single-site lease is left out of the total: 453 MW of power there was still undelivered, with payments tied to the landlord’s build cost up to US$16.9 billion.
Nebius mixes both. It owns a site in Finland and uses colocation halls run by others. Its signed leases not yet started were about US$13.9 billion, starting between 2026 and 2029. Nebius says owned sites will make up most of the capacity it brings online from 2027, naming Missouri, two Finnish sites and Alabama, which it says total more than 3 GW at full scale.
Each choice moves the risk. Leasing lets CoreWeave grow fast without building every hall, but the landlord’s build speed becomes its own. Owning gives Nebius more control and, it says, better margins, but it must pay for the buildings and the power gear itself.
See leases not yet commenced explained and colocation explained for how these leases and halls work.
How much power does each have?
Power is the true size of a neocloud. GPUs earn nothing until a powered hall is ready for them.
CoreWeave reported more than 1.7 GW of active power at 30 September 2026, after adding more than 200 MW in the quarter. It had more than 4.6 GW contracted. So about 2.9 GW, or roughly 63%, was signed but not yet running, by our arithmetic. It expects more than 1.85 GW active by the end of 2026.
Nebius said it has more than 4 GW of contracted power and expects 5 GW by the end of 2026. It expects to bring more than 1 GW of new capacity online each year. It did not give an active figure, so we cannot compare running power directly.
Our contracted power explained page covers why contracted and active power are so far apart.
Singapore and the rest of Asia
Both are moving into Asia, but from a small base. Nebius says it has signed customer agreements in Japan, Korea, India, Australia and Singapore since it launched in Asia-Pacific in the first quarter of 2026. Its first Asia-Pacific sites are two colocations in India, due to come online in 2027.
CoreWeave reports more than 1.3 GW of contracted power outside the US, including India, Indonesia and Spain. Neither company gives a Singapore power figure. For a Singapore reader, the practical point is that these neoclouds are selling to local customers before they run local halls.
Who gets paid?
- Nvidia, first. Both companies run Nvidia GPUs, including the new Vera Rubin systems. Nebius says it usually pays a substantial part of the price of server and network orders in advance.
- Lenders and noteholders. CoreWeave booked US$846 million of net interest expense in one quarter. Nebius pays interest on its convertible notes and a term loan, US$112.5 million in the quarter.
- Landlords and colocation owners. They are paid once each lease starts. CoreWeave’s US$47.4 billion and Nebius’s US$13.9 billion of signed leases are still waiting.
- Power suppliers. At Nebius’s New Jersey site the main power now comes from Bloom Energy fuel cells, after the site operator retired temporary generation.
- The neocloud, last. CoreWeave and Nebius earn only when a GPU is running a paying customer’s work. Both still reported net losses in the quarter.
Where is the stuck step?
Our read: power at the hall. Demand is not the problem for either company. Both have years of signed work. The slow part is turning contracted power into running GPUs.
CoreWeave’s 10-Q shows it plainly. At sites it has already leased, 807 MW of power was still to be delivered, 453 MW at one site and 354 MW at others, due in phases out to 2028. About 2.9 GW of its contracted power was not yet active.
Nebius says the same thing in its own words. Its owned sites are on time or ahead of schedule, it says, but third-party sites have slipped. Delivery dates at several colocation sites moved into the first half of 2027. In New Jersey, it now expects to deliver more than half of the capacity contracted with Microsoft by the end of 2026, with the rest in the second quarter of 2027.
Our CoreWeave power-on analysis and Wire note on CoreWeave’s backlog cover the waiting at CoreWeave.
The clocks
- Next three months. CoreWeave expects about US$9 billion of customer prepayments and deposits, its chief executive said on 10 November.
- End of 2026. CoreWeave aims for more than 1.85 GW active. Nebius aims for 5 GW contracted and more than half of its New Jersey capacity for Microsoft delivered.
- February 2027. Nebius now expects to reach the ARR it had guided to for December 2026.
- First half of 2027. Several Nebius colocation sites, including the last New Jersey tranches by the second quarter, are due to deliver.
- By 30 September 2028. About US$47.6 billion of CoreWeave’s RPO and US$15.5 billion of Nebius’s are due to become revenue, by our arithmetic.
- End of 2027. Nebius expects pre-tax breakeven.
What would change the view?
- Prepayments fade. If Nebius’s prepayment share on new deals falls back toward the 50% to 60% of the June quarter, it needs more debt, and the two models look more alike.
- CoreWeave’s debt cost drops. If interest falls well below a fifth of revenue, the borrowing model gets much cheaper and the gap narrows.
- Partnership revenue repeats or vanishes. If Nebius’s US$325.1 million of partnership revenue does not come back, its growth rate looks very different next quarter.
- Power arrives faster. If CoreWeave’s undelivered megawatts and Nebius’s delayed tranches fall quickly, the stuck step moves to GPUs or customers.
- A top customer pulls back. With 54% and 70% of revenue in two or three hands, one change at a big buyer would reshape either business.
Common misconceptions
- People assume CoreWeave and Nebius sell different things. Actually, both sell GPU computing time, mostly on multi-year contracts. The difference is how they pay for the build.
- People assume the bigger backlog means the safer business. Actually, backlog only turns into cash when power is live. Scaled to size, both hold RPO of more than 35 times their latest quarterly revenue.
- People assume Nebius has little debt. Actually, it carried about US$14.2 billion, mostly convertible notes. It is lower against equity because it also sold shares.
- People assume all of Nebius’s growth is recurring. Actually, about a third of its AI cloud revenue in the quarter came from strategic partnerships it calls non-recurring.
FAQ
What is the difference between CoreWeave and Nebius?
Both sell GPU computing time to AI labs and large companies. CoreWeave is bigger: US$3.66 billion of revenue in the September 2026 quarter against Nebius’s US$0.98 billion. CoreWeave funds its build mainly with debt and leased data centers. Nebius leans more on customer prepayments, equity and sites it owns.
Is CoreWeave bigger than Nebius?
Yes, on every reported measure. CoreWeave’s quarterly revenue was about 3.7 times Nebius’s, and its US$132.3 billion of remaining performance obligations was about 3.4 times Nebius’s US$38.7 billion at 30 September 2026, by our arithmetic. Nebius grew faster: revenue rose about 571% from a year earlier, against about 168% at CoreWeave.
Which has more debt, CoreWeave or Nebius?
CoreWeave. At 30 September 2026 it carried about US$46.9 billion of debt against US$4.0 billion of equity. Nebius carried about US$14.2 billion of debt, mostly convertible notes, against US$12.3 billion of equity. In the September quarter, CoreWeave’s net interest expense was about 23% of its revenue, and Nebius’s interest expense was about 11.5%.
Who are CoreWeave’s and Nebius’s biggest customers?
Both depend on a few buyers. At CoreWeave, two customers made up 30% and 24% of revenue in the September 2026 quarter. At Nebius, three customers made up 33%, 22% and 15%. Neither names them in that table. CoreWeave’s filing says Microsoft, OpenAI and Meta are significant customers, and Nebius says it has capacity contracted with Microsoft in New Jersey.
Does Nebius own its data centers?
Some of them. Nebius owns a site in Finland and says owned sites will make up most of the new capacity it brings online from 2027. It also uses colocation sites run by others, and those are where its recent delays happened. CoreWeave mostly leases, with US$47.4 billion of signed leases not yet started at 30 September 2026.
How much power do CoreWeave and Nebius have?
CoreWeave reported more than 1.7 GW of active power and more than 4.6 GW contracted at 30 September 2026. Nebius said it has more than 4 GW of contracted power and expects 5 GW by the end of 2026. Nebius did not give an active power figure in its results.
Is Nebius profitable?
Not on a net basis yet. Nebius reported a net loss from continuing operations of US$37.5 million in the September 2026 quarter, and adjusted EBITDA of US$465.8 million. It says it expects pre-tax breakeven by the end of 2027. CoreWeave reported a net loss of US$709 million in the same quarter.
Where is Nebius selling in Asia?
Nebius says it has signed customer agreements in Japan, Korea, India, Australia and Singapore since launching in Asia-Pacific in the first quarter of 2026. Its first Asia-Pacific sites are two colocations in India due to come online in 2027. CoreWeave reports more than 1.3 GW of contracted power outside the US, including India and Indonesia.
Related: neocloud vs hyperscaler; who are the neoclouds; GPU cloud providers; take-or-pay GPU contracts; GPU depreciation explained.
Stack doors
Layer: Neoclouds. Players: CoreWeave and Nebius. Analysis: Nebius idle GPUs and the stuck step. Wire: Nebius’s US$3.5 billion bridge loan.
Get the Wire — short daily notes on where AI computing gets built and who pays for it.
Not investment advice. Do your own research.
How we check this
Every CoreWeave and Nebius figure on this page comes from a filing on the SEC’s EDGAR system, read in full by us. CoreWeave’s come from its third-quarter 2026 results release, filed as Exhibit 99.1 to its Form 8-K of 10 November 2026, and its Form 10-Q for the quarter to 30 September 2026, filed 12 November 2026. Nebius’s come from four exhibits to its two Forms 6-K of 12 November 2026: the results release, the letter to shareholders, the Operating and Financial Review, and the unaudited financial statements. Neither company names its largest customers in its revenue table, so we do not match names to percentages. Nebius does not give an active power figure, so we do not estimate one. Debt totals, ratios, growth rates and the 24-month RPO amounts are our arithmetic, checked in code and labelled on the page. Who gets paid and the stuck step are our read. The featured image is a CC BY-SA 3.0 photograph of a server aisle, graded by us; it is illustrative and does not show a CoreWeave or Nebius site. This page explains how two businesses work. It does not rate either company as an investment or give buy or sell calls. Not investment advice. Do your own research.
Last reviewed: 22 Nov 2026 · Next review: when CoreWeave and Nebius report their fourth-quarter 2026 results
Spot an error? Tell us and we will correct it and note the change here.
References
- CoreWeave — Third Quarter 2026 results release, Form 8-K Exhibit 99.1 (10 Nov 2026) — Q3 revenue US$3,661m; adjusted EBITDA US$2,256m; net loss US$709m; revenue backlog about US$132.5bn; over 1.7 GW active and over 4.6 GW contracted power; 2026 guidance
- CoreWeave — Form 10-Q for the quarter ended 30 September 2026 (filed 12 Nov 2026) — RPO US$132.3bn and timing; customers over 10% of revenue; 98% of revenue from committed contracts; Meta order form; balance sheet debt and deferred revenue; leases not yet commenced US$47.4bn; undelivered power at leased sites
- Nebius Group — Third quarter 2026 results release, Form 6-K Exhibit 99.1 (12 Nov 2026) — Q3 revenue US$980.8m; adjusted EBITDA US$465.8m; net loss from continuing operations US$37.5m; capex; balance sheet
- Nebius Group — Letter to shareholders, Q3 2026, Form 6-K Exhibit 99.2 (12 Nov 2026) — US$12bn contract value signed since the start of Q3; prepayments over 100% of capex on Q3 deals; ACV per MW over US$25m; over 4 GW contracted power; New Jersey delays; 2026 and 2027 outlook
- Nebius Group — Operating and Financial Review, nine months to 30 September 2026, Form 6-K Exhibit 99.1 (12 Nov 2026) — Nebius AI cloud revenue US$973.8m including US$325.1m from strategic partnerships; interest expense; cash requirements table; useful-life change to five years
- Nebius Group — Unaudited condensed consolidated financial statements, Q3 2026, Form 6-K Exhibit 99.2 (12 Nov 2026) — RPO US$38.7bn and timing; customers over 10% of revenue; leases not yet commenced US$13,862.3m